Modules:RegistrationMetrics-Documentation-3.4
Return to Slicer 3.4 Documentation
Registration Metrics
MyModule
General Information
Module Type & Category
Type: CLI
Category: Registration
Authors, Collaborators & Contact
- Haytham Elhawary: Brigham and Women's Hospital, SPL
- Sota Oguro: Brigham and Women's Hospital, SPL
- Nobuhiko Hata: Brigham and Women's Hospital, SPL
- Contact: Haytham Elhawary, elhawary [at] bwh.harvard.edu
Module Description
This module is capable of calculating the 95% Hausdorff distance (HD) and the Dice Similarity Coefficient (DSC) between two label map images. If the two label map images represent registered segmented structures then the 95% HD and DSC will provide a measure of contour and volumetric alignment between the images. The HD is the maximum distance of a set to the nearest point in another set and gives a measure of contour alignment between structures. The DSC gives a measure of the volumetric overlap between the two segmented structures, and indicates twice the number of voxels which are shared by or are common to both structures divided by the total number of non-zero voxels in both structures. The DSC can range from zero to one, where zero is no alignment between images and one is perfect alignment. These two metrics are explained more formally in papers presented in the References section.
Usage
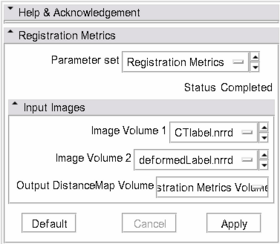
- Image Volume 1 and Image Volume 2 are two label map images which you wish to load and compare
- The module will provide the DSC and 95% HD between the two images, and will also provide an output volume. The output volume represents the contour of one of the images with each pixel value representing the Hausdorff Distance to the contour of the other image. Both the DSC and 95% HD will be printed onto the Log viewer in Slicer (can be accessed by clicking on the "X" icon that is located at the bottom right hand corner of the Slicer window) and on the Terminal for operating systems other than Windows.
- For improved visualization, the output image should be viewed with a color map. The code provides a color map entitled "Matlab_colormap.txt" which should be used for visualization of the output volume. Change the lower bound of the Threshold in the Display panel of the Volume Module to 0.01.
Examples, Use Cases & Tutorials
- Here are two example label map images, CTlabel.nrrd and Defolabel.nrrd: ExampleData
- Load them into the RegistrationMetrics Module, which can be found under the Registration category in the Modules menu.
- The DSC should be 0.959906 and the 95% HD is 3.66408mm, which is printed into the Log Viewer in Slicer and the Terminal
- An output volume named "Registration Metrics Volume" should be created, which shows the contour of one of the input images.
- Go to the Module named "Color" and load the text file named "Matlab_colormap.txt", which is provided with the source code of the RegistrationMetrics Module.
- Go to the Volumes tab, choose "Registration Metrics Volume" as the Active Volume and then in the Display panel, choose "Matlab_colormap.txt" in the Color Select menu.
- Change threshold to "manual" and make the lower bound of the interval 0.01. Change the Window/Level to make the output volume take on the range of colors from blue to red.
- The red pixels represent the pixels that have the highest HD with respect to the contour of the other input image. The pixel value shows the HD. This shows which part of the contour is further away (i.e. have highest grade of misalignment) from the contour of the other input image.
Development
Dependencies
No dependencies are required, except the Volume module to load images into Slicer.
Source code & documentation
Source code, color map and example data can be found here.
More Information
Acknowledgment
This work was made possible by Grants Number 5U41RR019703, 1R01CA124377 and 5U54EB005149 from NIH, and by Intelligent Surgical Instruments Project of METI (Japan).
References
The first publication refers to an explanation of the 95% Hausdorff distance and the second to the use of the Dice Similarity Coefficient.
- Archip N, Clatz O, Whalen S, et al. Non-rigid alignment of pre-operative MRI, fMRI, and DT-MRI with intra-operative MRI for enhanced visualization and navigation in image-guided neurosurgery. Neuroimage 2007; 35:609-624.
- A. Bharatha, M. Hirose, N. Hata, S. K. Warfield, M. Ferrant, K. H. Zou, E. Suarez-Santana, J. Ruiz-Alzola, A. D'Amico, R. A. Cormack, R. Kikinis, F. A. Jolesz, and C. M. Tempany, "Evaluation of three-dimensional finite element-based deformable registration of pre- and intraoperative prostate imaging," Med Phys, vol. 28(12), pp. 2551-60, 2001.

