Documentation/Nightly/Modules/QuantitativeIndicesCLI
|
For the latest Slicer documentation, visit the read-the-docs. |
Introduction and Acknowledgements
|
Acknowledgments:
The UIowa QIN QuantitativeIndicesCLI was funded in part by Quantitative Imaging to Assess Response in Cancer Therapy Trials NIH grant U01-CA140206 and Quantitative Image Informatics for Cancer Research (QIICR) NIH grant U24 CA180918. License: Slicer License | |||||||
|
General Information
Module Type & Category
Type: CLI
Category: Quantification
Module Description
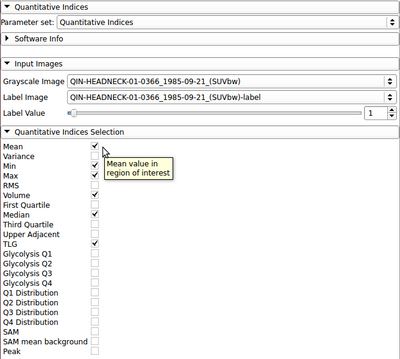
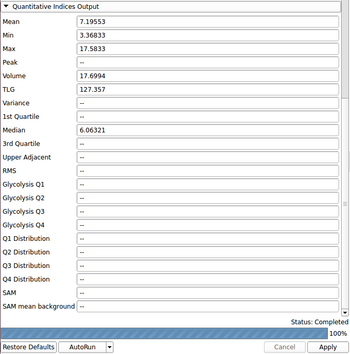
The QuantitativeIndicesCLI is a simple command line interface module for calculation of quantitative indices inside an image mask. Common indices (mean, min, max, median, etc.) may be calculated. The module also includes experimental indices for PET tumor quantification. For a more user-friendly interface and output, a helper module (Quantitative Indices Tool) has also been developed.
Index: Description (units for SUVbw images)
- Mean: mean value in region of interest (g/ml)
- Variance: variance in region of interest (g/ml)^2
- Min: minimum value in region of interest (g/ml)
- Max: maximum value in region of interest (g/ml)
- RMS: root-mean-square value in region of interest (g/ml)
- Volume: volume of region of interest (cm^3)
- First Quartile: 25th percentile value in region of interest (g/ml)
- Median: 50th percentile value in region of interest (g/ml)
- Third Quartile: 75th percentile value in region of interest (g/ml)
- Upper Adjacent: first value in region of interest not greater than 1.5 times the interquartile range (g/ml)
- TLG: total lesion glycolysis (g)
- Glycolysis Q1: lesion glycolysis calculated from the first quarter of the grayscale range within the region of interest (g)
- Glycolysis Q2: lesion glycolysis calculated from the second quarter of the grayscale range within the region of interest (g)
- Glycolysis Q3: lesion glycolysis calculated from the third quarter of the grayscale range within the region of interest (g)
- Glycolysis Q4: lesion glycolysis calculated from the fourth quarter of the grayscale range within the region of interest (g)
- Q1 Distibution: percent of gray values that fall within the first quarter of the grayscale range within the region of interest (%)
- Q2 Distibution: percent of gray values that fall within the second quarter of the grayscale range within the region of interest (%)
- Q3 Distibution: percent of gray values that fall within the third quarter of the grayscale range within the region of interest (%)
- Q4 Distibution: percent of gray values that fall within the fourth quarter of the grayscale range within the region of interest (%)
- SAM: standardized added metabolic activity (g)
- SAM mean background: intermediate value for calculating SAM, estimates local background near region of interest (g/ml)
- Peak: maximum average gray value that is calculated from a 1 cubic centimeter sphere placed within the region of interest (g/ml)
- Note: Peak returns NaN when measurement sphere does not fit completely within the region of interest.
Information for Developers
References
- Orlhac et al. "Tumor Texture Analysis in 18F-FDG PET: Relationships Between Texture Parameters, Histogram Indices, Standardized Uptake Values, Metabolic Volumes, and Total Lesion Glycolysis." JNM. 2014.
- El-Hafez et al. "Total lesion glycolysis: a possible new prognostic parameter in oral cavity squamous cell carcinoma." Oral Oncology. 2013; 49(3):261–8.
- Mertens et al. "Standardized added metabolic activity (SAM): a partial volume independent marker of total lesion glycolysis in liver metastases." EJNMMI. 2012; 39(9):1441–8.


