Documentation/4.8/Extensions/SlicerAstro
|
For the latest Slicer documentation, visit the read-the-docs. |
Introduction and Acknowledgements
Authors:
Davide Punzo (Kapteyn Astronomical Institute, University of Groningen)
Thijs van der Hulst (Kapteyn Astronomical Institute, University of Groningen)
Jos Roerdink (Johann Bernoulli Institute for Mathematics and Computer Science, University of Groningen)
Contributors:
Jean-Christophe Fillion-Robin (Kitware)
Steve Pieper (Isomics)
Andras Lasso (PerkLab, Queen's)
Acknowledgements:
This work was supported by the European Research Council under the European Union's Seventh Framework Programme (FP/2007-2013)/ERC Grant Agreement nr. 291-531.
Contacts:
- Davide Punzo, <email>punzodavide@hotmail.it</email>; <email>D.Punzo@astro.rug.nl</email>
- Thijs van der Hulst, <email>J.M.van.der.Hulst@astro.rug.nl</email>
- Jos Roerdink <email>j.b.t.m.roerdink@rug.nl</email>
Source: [1]
License: Slicer license
Download/install: install 3D Slicer, start 3D Slicer, open the Extension Manager, install the SlicerAstro extension[2].
Extension Description
|
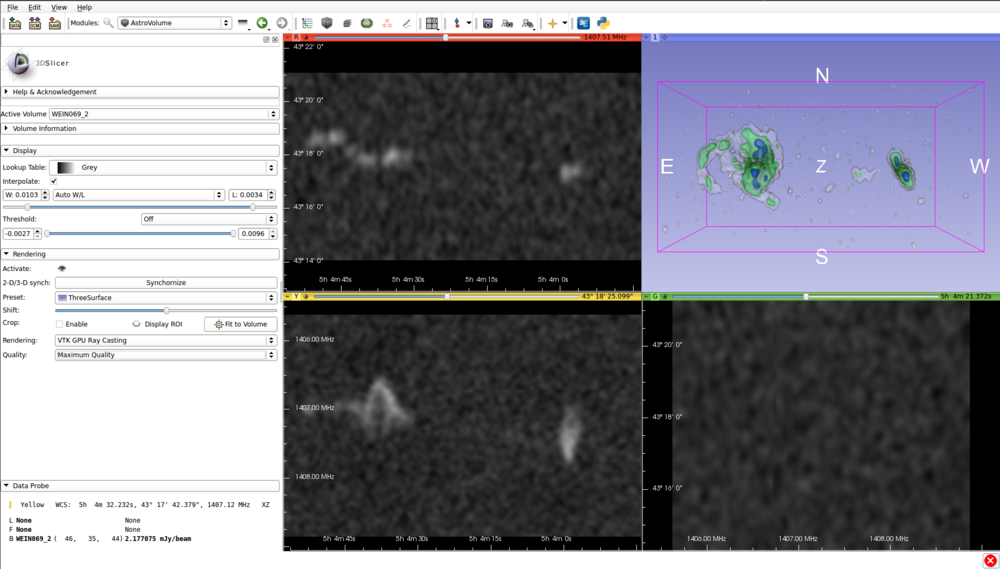
Upcoming HI (neutral Hydrogen) surveys will deliver large datasets, and automated processing using the full 3-D information (two positional dimensions and one spectral dimension) to find and characterize HI objects is imperative. In this context, visualization is an essential tool for enabling qualitative and quantitative human control on an automated source finding and analysis pipeline. Visual Analytics, the combination of automated data processing and human reasoning, creativity and intuition, supported by interactive visualization, enables flexible and fast interaction with the 3-D data, helping the astronomer to deal with the analysis of complex sources. 3-D visualization, coupled to modeling, provides additional capabilities helping the discovery and analysis of subtle structures in the 3-D domain. Objective: general description
|

