Documentation/4.4/Modules/IntensityDifferenceMetric
|
For the latest Slicer documentation, visit the read-the-docs. |
Introduction and Acknowledgements
|
This work is supported by NA-MIC, NAC, NCIGT, and the Slicer Community. This work is partially supported by Brain Science Foundation and NIH U01 CA151261. | |||||||
|
Module Description
|
Intensity Difference Metric can be used to quantify the differences between the two images. The assumptions made by this metric are that:
|
Use Cases
Most frequently used for these scenarios:
- This metric is used in the last step of processing by ChangeTracker.
- The metric can be used on its own, as long as the assumptions listed above are considered.
Tutorials
See ChangeTracker documentation.
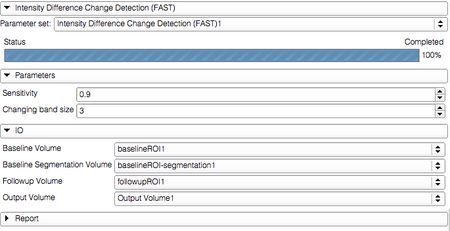
Panels and their use
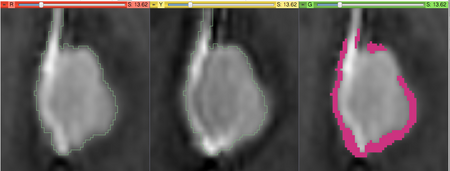
The logic used in this module is the following. It is assumed that the changes are happening near the boundary of the object, which should be defined by a segmentation in the baseline volume. Therefore, it is also assumed that the difference in intensity for the voxels inside the object are due to noise.
The processing steps are first to estimate the noise level using the signal difference in the inner portion of the object, and then categorize the voxels near the boundary as "growth" or "shrinkage" based on whether they are located inside or outside the voxel, and whether signal increases or decreases in the followup volume compared to baseline.
For a more formal description of the method take a look at the papers in the References section.
|
Similar Modules
References
- Konukoglu, E., Wells, W. M., Novellas, S., Ayache, N., Kikinis, R., Black, P. M., & Pohl, K. M. (2008). Monitoring slowly evolving tumors. 2008 5th IEEE International Symposium on Biomedical Imaging: From Nano to Macro (pp. 812-815). IEEE. doi:10.1109/ISBI.2008.4541120 URL
- Pohl, K. M., Konukoglu, E., Novellas, S., Ayache, N., Fedorov, A., Talos, I.-F., Golby, A., et al. (2011). A new metric for detecting change in slowly evolving brain tumors: validation in meningioma patients. Neurosurgery, 68(1 Suppl Operative), 225-33. doi:10.1227/NEU.0b013e31820783d5 URL
Information for Developers
| Section under construction. |


