Difference between revisions of "Modules:RegistrationMetrics-Documentation-3.4"
(→Usage) |
|||
| Line 44: | Line 44: | ||
* Change threshold to "manual" and make the lower bound of the interval 0.01. Change the Window/Level to make the output volume take on the range of colors from blue to red. | * Change threshold to "manual" and make the lower bound of the interval 0.01. Change the Window/Level to make the output volume take on the range of colors from blue to red. | ||
* The red pixels represent the pixels that have the highest HD with respect to the contour of the other input image. The pixel value shows the HD. This shows which part of the contour is further away (i.e. have highest grade of misalignment) from the contour of the other input image. | * The red pixels represent the pixels that have the highest HD with respect to the contour of the other input image. The pixel value shows the HD. This shows which part of the contour is further away (i.e. have highest grade of misalignment) from the contour of the other input image. | ||
| − | |||
| − | |||
| − | |||
| − | |||
| − | |||
| − | |||
| − | |||
| − | |||
== Development == | == Development == | ||
Revision as of 22:38, 29 June 2009
Home < Modules:RegistrationMetrics-Documentation-3.4Return to Slicer 3.4 Documentation
Registration Metrics
MyModule
General Information
Module Type & Category
Type: CLI
Category: Registration
Authors, Collaborators & Contact
- Haytham Elhawary: Brigham and Women's Hospital, SPL
- Sota Oguro: Brigham and Women's Hospital, SPL
- Nobuhiko Hata: Brigham and Women's Hospital, SPL
- Contact: Haytham Elhawary, elhawary [at] bwh.harvard.edu
Module Description
This module is capable of calculating the 95% Hausdorff distance (HD) and the Dice Similarity Coefficient (DSC) between two label map images. If the two label map images represent registered segmented structures then the 95% HD and DSC will provide a measure of contour and volumetric alignment between the images.
Usage
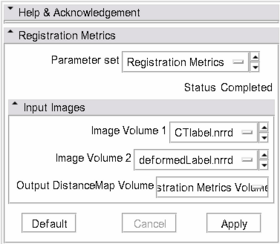
- Image Volume 1 and Image Volume 2 are two label map images which you wish to load and compare
- The module will provide the DSC and 95% HD between the two images, and will also provide an output volume. The output volume represents the contour of one of the images with each pixel value representing the Hausdorff Distance to the contour of the other image. Both the DSC and 95% HD will be printed onto the Log viewer in Slicer (can be accessed by clicking on the "X" icon that is located at the bottom right hand corner of the Slicer window) and on the Terminal for operating systems other than Windows.
- For improved visualization, the output image should be viewed with a color map. The code provides a color map entitled "Matlab_colormap.txt" which should be used for visualization of the output volume. Change the lower bound of the Threshold in the Display panel of the Volume Module to 0.01.
Examples, Use Cases & Tutorials
- Here are two example label map images, CTlabel.nrrd and Defolabel.nrrd: ExampleData
- Load them into the RegistrationMetrics Module, which can be found under the Registration category in the Modules menu.
- The DSC should be 0.959906 and the 95% HD is 3.66408mm, which is printed into the Log Viewer in Slicer and the Terminal
- An output volume named "Registration Metrics Volume" should be created, which shows the contour of one of the input images.
- Go to the Module named "Color" and load the text file named "Matlab_colormap.txt", which is provided with the source code of the RegistrationMetrics Module.
- Go to the Volumes tab, choose "Registration Metrics Volume" as the Active Volume and then in the Display panel, choose "Matlab_colormap.txt" in the Color Select menu.
- Change threshold to "manual" and make the lower bound of the interval 0.01. Change the Window/Level to make the output volume take on the range of colors from blue to red.
- The red pixels represent the pixels that have the highest HD with respect to the contour of the other input image. The pixel value shows the HD. This shows which part of the contour is further away (i.e. have highest grade of misalignment) from the contour of the other input image.
Development
Dependencies
Other modules or packages that are required for this module's use.
Known bugs
Follow this link to the Slicer3 bug tracker.
Usability issues
Follow this link to the Slicer3 bug tracker. Please select the usability issue category when browsing or contributing.
Source code & documentation
Customize following links for your module.
Links to documentation generated by doxygen.
More Information
Acknowledgment
Include funding and other support here.
References
Publications related to this module go here. Links to pdfs would be useful.

