Documentation/Nightly/Modules/PkModeling
|
For the latest Slicer documentation, visit the read-the-docs. |
Introduction and Acknowledgements
|
Extension: PkModeling | |||||||
|
Module Description
|
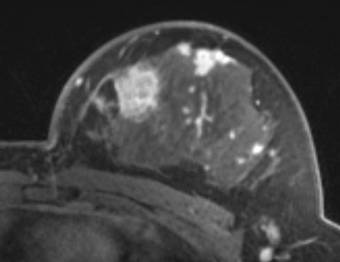
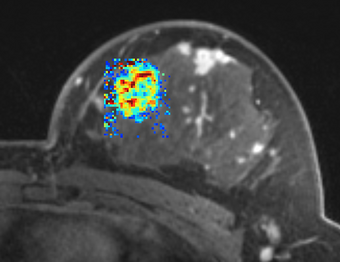
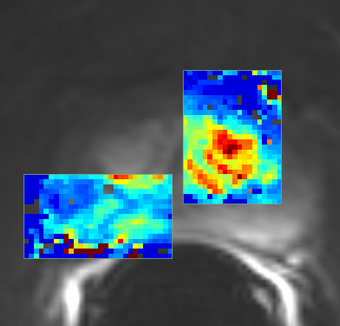
PkModeling (Pharmacokinetics Modeling) calculates quantitative parameters from Dynamic Contrast Enhanced DCE-MRI images. This module performs two operations:
|
Use Cases
- estimation of quantitative perfusion parameters from DCE MRI
- treatment response evaluation
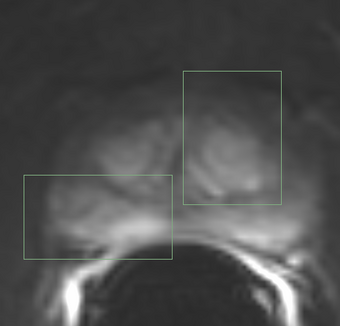
- breast, prostate, brain DCE MRI analysis
Tutorials
- "Exploration and Study of MultiVolume Image Data using 3D Slicer" by Meysam Torabi, Brigham and Women's Hospital: https://github.com/QIICR/PkModeling/files/3875977/MultiVolumeExplorer_Meysam_SNR-April2013-v4.pdf
- "3D Slicer for DCE-MRI Image Analysis" by Madeline Carr, University of Wollongong Australia: https://github.com/QIICR/PkModeling/files/3870911/DCE.and.3D.Slicer.Tutorial.pdf
Panels and their use
|
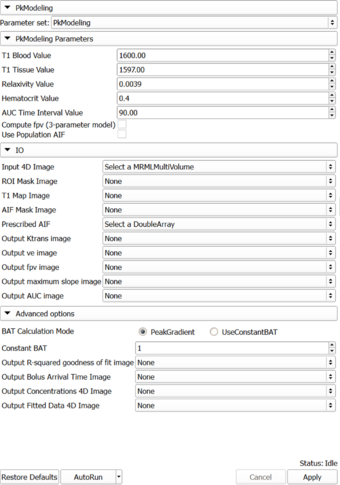
The following acquisition parameters should be available in the NRRD header of the input data (if you are analyzing a DICOM time series, they will typically be extracted from the DICOM data):
- TR Value: Repetition time (milliseconds)
- TE Value: Echo time (milliseconds)
- FA Value: Flip angle (degrees)
- Timestamps for the dynamic series (in milliseconds)
Here is an example how this information is represented in the NRRD header:
MultiVolume.DICOM.EchoTime:=2.93
MultiVolume.DICOM.FlipAngle:=10
MultiVolume.DICOM.RepetitionTime:=6.13
MultiVolume.FrameIdentifyingDICOMTagName:=AcquisitionTime
MultiVolume.FrameIdentifyingDICOMTagUnits:=ms
Auto generated documentation of the parameters
Parameters:
- PkModeling Parameters: Parameters used for PkModeling
- T1 Blood Value (T1PreBloodValue): T1 value for blood.
- T1 Tissue Value (T1PreTissueValue): T1 value for tissue.
- Relaxivity Value (RelaxivityValue): Contrast agent relaxivity value. Default value corresponds to Gd-DPTA (Magnevist) at 3T.
- Signal Gradient Threshold Value (S0GradValue): Signal Gradient Threshold value.
- F Tolerance Value (FTolerance): Tolerance on function value for establishing convergence.
- G Tolerance Value (GTolerance): Tolerance on gradient value for establishing convergence.
- X Tolerance Value (XTolerance): Tolerance on parameter values for establishing convergence.
- Epsilon Value (Epsilon): Epsilon value.
- Maximum number of iterations (MaxIter): Maximum number of iterations in optimizing the parameter estimation at each voxel.
- Hematocrit Value (Hematocrit): Hematocrit value, volume percentage of red blood cells in blood.
- AUC Time Interval Value (AUCTimeInterval): AUC Time Interval value.
- Compute fpv (3-parameter model) (ComputeFpv): Enable estimation of fractional plasma volume at each voxel.
- Use Population AIF (UsePopulationAIF): Use generic population AIF.
- IO: Input/output parameters
- Input 4D Image (InputFourDImageFileName): Input 4D Image (txyz)
- ROI Mask Image (ROIMaskFileName): (Optional) Mask designating the voxels (non-zero) where the model should be fit. If not specified, the model will be fit to all voxels in the image.
- T1 Map Image (T1MapFileName): (Optional) Volume defining T1 value for each voxel.
- AIF Mask Image (AIFMaskFileName): Mask designating the location of the arterial input function (AIF). AIF can be calculated from a generic population AIF, the input using the aifMask or can be prescribed directly in concentration units using the prescribedAIF option.
- Prescribed AIF (PrescribedAIFFileName): Prescribed arterial input function (AIF). AIF can either be calculated from the input using the aifMask option or can be prescribed directly in concentration units using the prescribedAIF option.
- Output Ktrans image (OutputKtransFileName): Output volume transfer constant between blood plasma and EES (extracellular-extravascular space) at each voxel.
- Output ve image (OutputVeFileName): Output fractional volume for extracellular space at each voxel.
- Output fpv image (OutputFpvFileName): Output fractional plasma volume at each voxel.
- Output maximum slope image (OutputMaxSlopeFileName): Output maximum slope in the time series curve of each voxel.
- Output AUC image (OutputAUCFileName): Output area under the curve (AUC) of each voxel, measured from bolus arrival time to the end time of interval, normalized by the AUC of the AIF.
- Advanced options: Debugging and advanced research options.
- BAT Calculation Mode (BATCalculationMode): Determine how to calculate bolus arrival time.
- Constant BAT (ConstantBAT): Constant Bolus Arrival Time index(frame number).
- Output R-squared goodness of fit image (OutputRSquaredFileName): R-squared goodness of fit of the model to each voxel. Setting this output changes the returned images. When this output is not used, the output parameter volumes only contain the voxels where good fits were obtained. When this output is set, the parameter volumes for every voxel is output and may be masked by the R-squared volume in a separate module.
- Output Bolus Arrival Time Image (OutputBolusArrivalTimeImageFileName): Output Per-Pixel Bolus Arrival Time (xyz)
- Output Concentrations 4D Image (OutputConcentrationsImageFileName): Output Concentrations 4D Image (txyz)
- Output Fitted Data 4D Image (OutputFittedDataImageFileName): Output Fitted Data 4D Image (txyz)
- Output Diagnostics Image (OutputOptimizerDiagnosticsImageFileName): Output map with the optimizer diagnostics. The code is encoded in 2 hex numbers. Lower 4 bits encode the optimizer errors are as follows:\n0: OIOIOI -- failure in leastsquares function\n1: OIOIOI -- lmdif dodgy input\n2: converged to ftol\n3: converged to xtol\n4: converged nicely\n5: converged via gtol\n6: too many iterations\n7: ftol is too small. no further reduction in the sum of squares is possible.\n8: xtol is too small. no further improvement in the approximate solution x is possible.\n9: gtol is too small. Fx is orthogonal to the columns of the jacobian to machine precision.\n10: OIOIOI: unknown info code from lmder.\n11: optimizer failed, but diagnostics string was not recognized.\nUpper 4 bits encode other non-optimizer errors or notifications:\n16 (0x10): Ktrans was clamped to [0..5].\n32 (0x20): Ve was clamped to [0..1].\n48 (0x30): BAT detection failed.\n64 (0x40): BAT at the voxel was less than AIF BAT.\n
List of parameters generated transforming this XML file using this XSL file. To update the URL of the XML file, edit this page.
Similar Modules
References
- [1] Knopp MV, Giesel FL, Marcos H et al: Dynamic contrast-enhanced magnetic resonance imaging in oncology. Top Magn Reson Imaging, 2001; 12:301-308.
- [2] Rijpkema M, Kaanders JHAM, Joosten FBM et al: Method for quantitative mapping of dynamic MRI contrast agent uptake in human tumors. J Magn Reson Imaging 2001; 14:457-463.
- [3] de Bazelaire, C.M., et al., MR imaging relaxation times of abdominal and pelvic tissues measured in vivo at 3.0 T: preliminary results. Radiology, 2004. 230(3): p. 652-9.
- [4] Pintaske J, Martirosian P, Graf H, Erb G, Lodemann K-P, Claussen CD, Schick F. Relaxivity of Gadopentetate Dimeglumine (Magnevist), Gadobutrol (Gadovist), and Gadobenate Dimeglumine (MultiHance) in human blood plasma at 0.2, 1.5, and 3 Tesla. Investigative radiology. 2006 March;41(3):213–21.
- [5] Parker GJ, Roberts C, Macdonald A, Buonaccorsi GA, Cheung S, Buckley DL, Jackson A, Watson Y, Davies K, Jayson GC. Experimentally-derived functional form for a population-averaged high-temporal-resolution arterial input function for dynamic contrast-enhanced MRI. Magnetic Resonance in Medicine, 2006 Nov; 56(5):993-1000.
- [6] Huang, W., Li, X., Chen, Y., Li, X., Chang, M.-C., Oborski, M. J., … Kalpathy-Cramer, J. (2014). Variations of dynamic contrast-enhanced magnetic resonance imaging in evaluation of breast cancer therapy response: a multicenter data analysis challenge. Translational Oncology, 7(1), 153–66. doi:10.1593/tlo.13838 http://dx.doi.org/10.1593/tlo.13838
- [7] Tofts, P. S., Brix, G., Buckley, D. L., Evelhoch, J. L., Henderson, E., Knopp, M. V, … Weisskoff, R. M. (1999). Estimating kinetic parameters from Contrast-Enhanced T 1 -Weighted MRI of a Diffusable Tracer : Standardized Quantities and Symbols. J Magn Reson Imaging, 10(3), 223–232.
Information for Developers
| Section under construction. |
Source code: https://github.com/millerjv/PkModeling .
