Documentation/4.8/Modules/MultiVolumeExplorer
|
For the latest Slicer documentation, visit the read-the-docs. |
Introduction and Acknowledgements
|
This work is supported by NA-MIC, NAC, NCIGT, and the Slicer Community. This work is partially supported by the following grants: P41EB015898, P41RR019703, R01CA111288 and U01CA151261. | |||||||||||
|
Module Description
This module provides support for exploring multivolume (multiframe) data.
Use Cases
Most frequently used for these scenarios:
- visualization of a DICOM dataset that contains multiple frames that can be separated based on some tag (e.g., DCE MRI data, where individual temporally resolved frames are identified by Trigger Time tag (0018,1060)
- visualization of multiple frames defined in the same coordinate frame, saved as individual volumes in NRRD, NIfTI, or any other image format supported by 3D Slicer
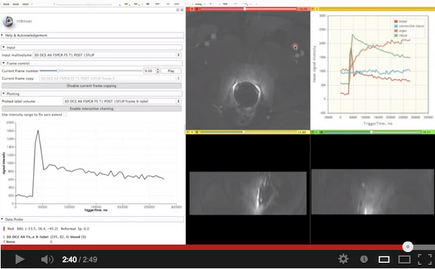
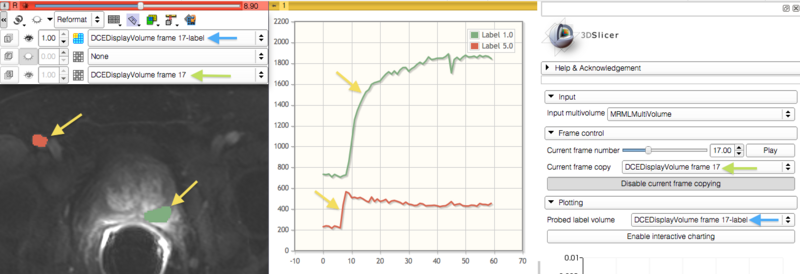
- exploration of the multivolume data (cine mode visualization, plotting, volume rendering)
Tutorials
|
Panels and their use
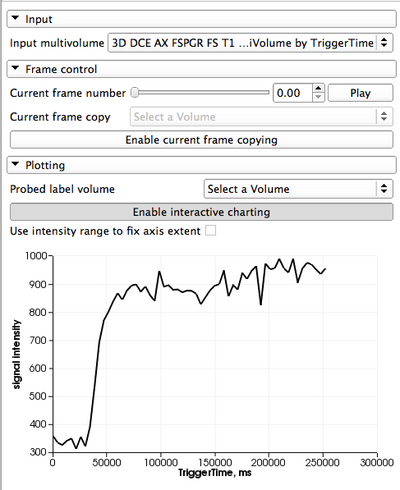
Input data Before the module can be used, you should import the data into a MultiVolume node that you can choose as input in this module. There are two options to do this:
- If your data is in DICOM format, you should first import it into Slicer DICOM database using DICOM module. Once imported, you should click on the series containing the multi-frame data in the DICOM browser. If DICOM module detects multi-frame dataset in the series, you should see the MultiVolume option in the list of load options for the series.
- If your data is stored as a collection of NRRD/NIFTI/etc volumes per time-point, you should use MultiVolume Importer module to first create a MultiVolume node from your file collection, and then use the resulting MultiVolume node as input for the Explorer module.
|
Related Modules
Before multivolume data can be viewed/explored, it has to be loaded using either DICOM (if the dataset is in DICOM format) or MultVolumeImporter modules.
Documentation/Nightly/Modules/PkModeling extension can be used for pharmacokinetic analysis of the DCE MRI data.
References
- Development of this module was initiated at the 2012 NA-MIC Project week at SLC (see http://wiki.na-mic.org/Wiki/index.php/2012_Project_Week:4DImageSlicer4)
Information for Developers
This module is an external Slicer module. The source code is available on Github here: https://github.com/fedorov/MultiVolumeExplorer
Features to be implemented
- allow the user to speed-up or slow-down the playback, and also turn off "loop"
- report to the user the actual, measured, frame rate
Features under consideration
- can we use chart viewer for interactive plotting? -- Discussed with Jim, speedup is possible, but not a priority right now
- interactive update of the active frame based on the point selected in the chart viewer
- add GUI elements to update the current frame at the exact time intervals specified in multivolume. If the intervals are non-uniform, I am not sure I can use the timer anymore, so this would require some extra thought.
- import multivolumes from ITK 4d images


