Documentation/4.10/Modules/PETCPhantomAnalysis
|
For the latest Slicer documentation, visit the read-the-docs. |
Introduction and Acknowledgements
|
Acknowledgments:
The UIowa QIN PET Phantom Analysis tool was funded in part by Quantitative Imaging to Assess Response in Cancer Therapy Trials NIH grant U01-CA140206 and Quantitative Image Informatics for Cancer Research (QIICR) NIH grant U24 CA180918. License: Slicer License | |||||||
|
Module Description
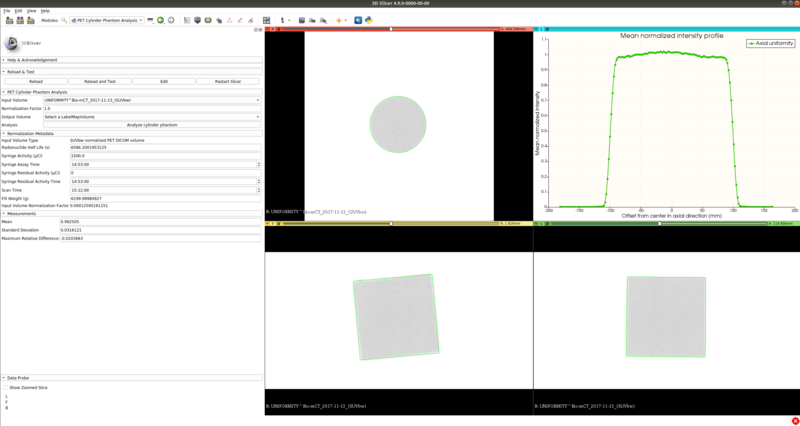
Module for automated analysis of Uniform Cylinder Phantoms in PET scans utilized for quality control purposes. Quantitative verification of calibration and spatial homogeneity of PET scanners is an essential prerequisite for quantitative analysis of clinical PET scans. For this purpose uniform cylindrical phantoms are commonly utilized. The provided module enables automated analysis of produced PET scans.
Basic usage
- Load cylinder phantom PET scan from Slicer's DICOM database. For loading the dataset in SUV normalized form, you may use the DICOM PET SUV Plugin which is part of the UIowa QIN PET DICOM Extension.
- Go to the “PET Cylinder Phantom Analysis” module.
- Select the loaded PET scan as "Input Volume".
- In section "Normalization metadata" verify and if needed adjust phantom fill information.
- Click "Analyze cylinder phantom".
- Verify correctness of the matched cylinder region (green outline overlaid on PET volume).
- In section "Measurements" read the measured "Mean", "Standard Deviation" and "Maximum Relative Difference" SUV values of the identified cylinder and verify that they are within recommended ranges.
- Check axial uniformity in the mean normalized intensity profile.


