Documentation/4.6/Modules/LabelStatistics
|
For the latest Slicer documentation, visit the read-the-docs. |
Introduction and Acknowledgements
|
This work is part of the National Alliance for Medical Image Computing (NA-MIC), funded by the National Institutes of Health through the NIH Roadmap for Medical Research, Grant U54 EB005149. Information on NA-MIC can be obtained from the NA-MIC website. The development of this module was supported in part by NIH grants RR13218. | |||||||
|
Module Description
Calculate image and volume properties using a label map and a gray scale image.
Use Cases
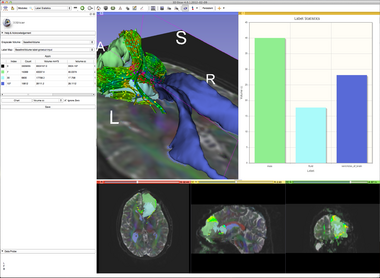
The module is fairly simple. Just select a background volume and a label volume (for example, as created using the Editor Module) and click Apply.
The volumes of the table show:
- Label there is one row for each unique value in the label volume
- Count is the number of pixels in the label volume that have this value
- Volume mm^3 is the product of the pixel spacings (volume per pixel) times the Count in cubic millimeters
- Volume cc is the product of the pixel spacings (volume per pixel) times the Count in cubic centimeters (there are 1000 mm^3 per cc)
- Min, Max, Mean, StdDev Statistics on the grayscale pixel values at the locations that correspond to the label value.
- The Export to table button can be used to create a table node from the contents of the calculated table. The table can be viewed and edited in Slicer, results can be copy-pasted to spreadsheet applications for further analysis or plotting (click in the top-left corner of the table to select all contents and then press Ctrl-C top copy). Also, tables can be saved to tab or comma separated value file format (.tsv or .csv file extension) by selecting in the menu: File / Save (or pressing Ctrl-s). This format can easily be opened in spreadsheet programs for further analysis or plotting. Example .csv file contents are shown below.
"Index","Count","Volume mm^3","Volume cc","Min","Max","Mean","StdDev"
0,8511233,11064563.9387,11064.5639387,0.0,279.0,33.656842199,37.6109663358
1,8447,10981.0613327,10.9810613327,0.0,170.0,70.974783947,23.789514355
- The Chart button allows you to create a new bar chart based on the results of your label statistics analysis. Any of the calculated quantities, such as per-structure volume in cubic millimeters can be used as the y-axis for the bar chart, and there will be one bar per unique voxel value in the label map. If the Ignore Zero option is selected, then there will be no bar for the zero value of the label map, since that would often include many samples that have no clinical interest (such as air outside the body cavity).
Tutorials
Links to tutorials that use this module
Panels
N/A
Similar Modules
N/A
References
N/A
Information for Developers
| Section under construction. |


