Documentation/4.5/SlicerApplication/MainApplicationGUI
|
For the latest Slicer documentation, visit the read-the-docs. |
Overview
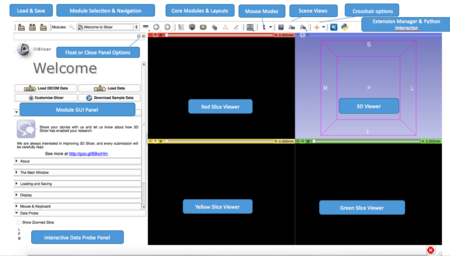
Slicer4's main desktop interface provides top-level access to most commonly-used features, and organizes them into logical groupings. These groups of features are presented in a number of interface panels on the GUI, as is illustrated in the basic layout below. The interface is designed to be easy to learn and remember, to ease navigation of Slicer's large (and growing) functionality, and to easily collapse and hide when you don't need to see it.
Application Menu
Slicer's Application Menu contains many useful features. A brief overview of some of these is given below.
- File Menu
- The File Menu contains options for loading a MRML scene, for downloading sample datasets from the internet, or individual datasets of various types. An option for saving scenes and data is also provided here.
- Edit Menu
- The Edit menu contains an option to raise the Application Settings Interface. This interface allows users to customize their installation of Slicer. 'Edit->Application Settings can be used to include or suppress various Slicer modules, to customize the appearance of your Python Interactor, to select a custom font, to specify a temporary directory, and to accomplish other customizations as well.
- View Menu
- This menu contains options to raise the Python Interactor and the Error Log, both useful developer tools. Menu options to switch layouts, and to toggle the display of individual toolbars and the module GUI panels are also provided under the View Menu.
Toolbar
The Toolbar provides shortcuts to many useful sets of functionality. The following toolbars appear here by default. Customization is possible from the Slicer View Menu.
Load & Save Options
The Load Scene option will raise a browser to select and load a collection of data as a MRML scene. This option clears the existing scene and resets the application state. The Save option will raise the "Save Data" Interface which offers a variety of options for saving MRML scenes and individual datasets.
The Module Selection & Navigation toolbar provides options for searching for module names, selecting from a module menu, and moving backward and forward through the module selection history for convenience.
Core Modules
The Core Module Toolbar provides shortcuts to your "Home" module, and some of Slicer's core modules including
- Models
- Transforms
- Data
- Volumes
- Annotations
- Interactive Editor
Layouts
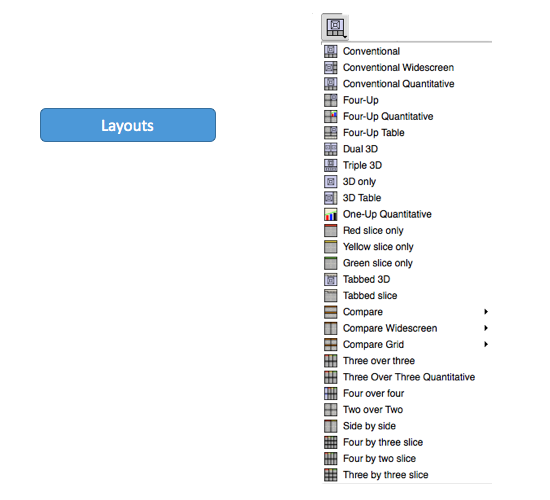
The Layout Toolbar provides a drop-down menu of layouts useful for many types of studies. When Slicer is exited normally, the selected layout is saved and restored as part of the Application state.
Mouse Modes
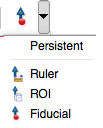
Slicer has two mouse modes: Transform (which allows interactive rotate, translate and zoom operations), and Place (which permits objects to be interactively placed in 3D or 2D). The toolbar icons that switch between these mouse modes are shown from left to right above, respectively. Place Fiducial is the default place option as shown above; options to place both Ruler and Region of Interest Widgets are also available from the drop-down Place Mode menu. Hint: Transform mode is the default interaction mode. By default, Place mode persists for one "place" operation after the Place Mode icon is selected, and then the mode switches back to Transform. Place mode can be made persistent (useful for creating multiple fiducial points, rulers, etc.) by checking the Persistent checkbox shown rightmost in the Mouse Mode Toolbar.
Screenshots & Scene Views
This toolbar presents options for capturing screenshots (1st icon) and Scene Views (2nd icon) and restoring saved scene views (3rd icon).
- A Screenshot can be taken at multiples of the resolution visible on the screen. This allows the taking of higher quality pictures for publication. Saving the screenshots is possible in the save menu. At that time the format of the file can be specified. More information on saving is in the Load and Save toolbar.
- A Scene View is a description of the state of the MRML scene at the time of its capture that can be restored at any time. This mechanism is useful for preparing and viewing multiple interesting presentations of a complicated dataset. More information in the Scene Views module.
Crosshair Options
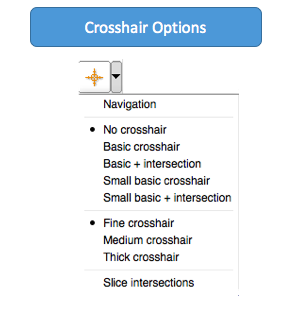
The Crosshair Toolbar provides a set of options for customizing the appearance and behavior of the crosshairs across all Slice Viewers.
Module Panel
Any selected module in Slicer will display its user interface in the Module Panel. The panel may be undocked (by left-clicking & dragging the panel chrome or by selecting its undock icon; hidden by selecting the hide (X) icon, or have its display toggled by selecting View->Module Panel. The panel can be re-docked by double-clicking on its chrome.
Data Probe
The Data Probe interactively reports data values at voxels indexed by the current mouse position in all layers (Label, Foreground and Background).
See the Data Probe documentation for more information about the data values displayed.
3D Viewer
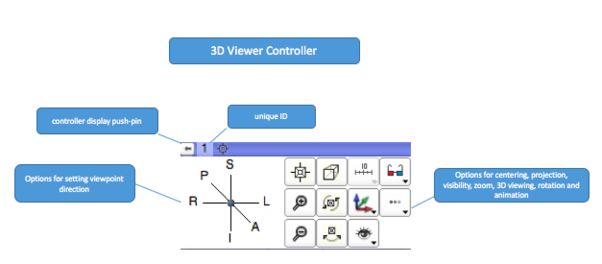
Access the 3D Viewer Controller by mousing over the push-pin icon in the top left corner of any 3D Viewer.
- The panel may be opened persistently by clicking the push-pin icon which effectively "pins" it open. Clicking again "unpins" the panel.
- Next to the push-pin, a unique ID may be found that distinguishes this 3D viewer from other 3D viewers that may have been created when other layouts were selected.
- Finally there is a Center the View button to set the virtual camera to show everything that is visible in the viewer at that point.
- The panel contains options for setting the viewpoint direction, and configuring the appearance and behavior of any 3D Viewer. This includes buttons to set slicer to rock or orbit in the irghtmost column. The eye icon contains controls for visibility of the orientation letters and the bounding box in the 3D viewer.
- Depth peeling is a multipass technique to render translucent polygonal geometry without sorting polygons. It can be used to solve semi-transparent surface model rendering issues.
Slice Viewers
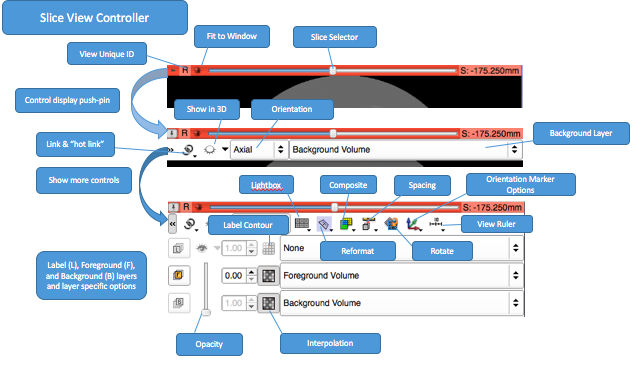
Access any Slice Viewer's Controller by mousing over its push-pin icon in the top left corner of any slice viewer. The panel may also be opened persistently by clicking the push-pin icon. Next to the push-pin a unique ID may be found that distinguishes the particular Slice Viewer from other Slice Viewers that may have been created when other layouts were selected. A Slice Scrollbar is provided for manually sweeping through slices and a slice number entry widget is also provided at the top right of the display for manually indexing a particular slice. Each Slice Viewer contains options for displaying each of the layers (Foreground, Background and Label). For the Foreground and Label layers, the opacity of the layer can be controlled by using the spinbox opacity widget (pointed by the "Opacity" annotation in the figure below). In addition, the visibility of the Label layer can be toggled between the "contour" and "solid" mode (see "Label contour" button in the diagram below).
Some Slice Viewer configuration options may be applied to one or all Slice Viewers by using the Link option. When viewers are unlinked, an option applies only to the viewer being adjusted. When viewers are linked, the option will apply to all Slice Viewers. The application of an operation or interaction when viewers are linked is propagated to the other viewers only after the interaction with the current viewer is complete. For example, zooming within a viewer when the viewers are linked will interactively zoom the current viewer and upon completion of the interaction, the effect of the zoom will be propagated to the other viewers. The Hot-Link setting modifies this behavior such the effect of an interaction is immediately applied to all viewers. Link and Unlink are persistent settings. The linking behavior for Slice Viewer settings and interactions is further describe here.
Chart Viewers
Access any Chart Viewer's Controller by mousing over its push-pin icon in the top left corner of any chart viewer. The panel may also be opened persistently by clicking the push-pin icon. Next to the push-pin a unique ID may be found that distinguishes the particular Chart Viewer from other Chart Viewers that may have been created when other layouts were selected. Each Chart Viewer contains options for controlling the content and display of a Chart.
The content and display of a Chart is controlled by selecting a specific Chart for the Chart Viewer. A Chart Viewer can switch between multiple Charts by selecting different Charts from the Scene. The type of the chart can Line, Bar, or Scatter. The style can be modified by toggling the display of Lines and Markers for the data or by toggling the display of a Grid or the Legend. The content of the Chart can be modified by adding and removing individual Arrays from the Chart. The Chart's Title, X-axis Label, and Y-axis Label can be edited using the controls in the Chart Viewer's Controller.
Mouse & Keyboard Across Platforms
Below is basic information about how to use the three-, two-, and one-button mouse (or trackpad) on Windows, Mac, and Linux platforms to perform basic interaction operations in Slicer.
Adjusting Window & Level on All Platforms
Left-clicking and dragging the mouse in any Slice viewer is a quick way to adjust Window and Level. Adjust the middle value (level) of the greyscale window by moving the mouse up (increase level) or down (decrease level), and adjust the greyscale window size by moving the mouse to the left (decrease window size) or right (increase window size). Slicer's Volumes Module provides a "Display" interface panel for making more precise adjustments.
Selecting & Manipulating on All Platforms
Mousing over any "pickable" object in any of Slicer's viewers will cause the cursor to change from a "pointer" into a "picking hand". When the cursor shows a picking hand, left-clicking and dragging the mouse will pick and manipulate the object. Releasing the mouse button will deselect the object.
Viewer Cross-Reference on All Platforms
Holding down the Shift-Key while moving the mouse in any Slice Viewer will cause other Slice Viewers to interactively scroll to the same RAS position indexed by the mouse. This feature is useful when inspecting multiple registered studies.
Zoom In & Out in Slice & 3D Viewers
- Windows, Mac & Linux with
- 3-Button Mouse: Right-click & drag down & up
- 2-Button Mouse: Right-click & drag down & up
- 1-Button Mouse: Ctrl+Left-click & drag down & up
- Mac with trackpad: two-finger click & drag
Pan (Translate) in Slicer & 3D Viewers
- Windows, Mac & Linux with
- 3-Button Mouse: Middle-click & drag
- 2-Button Mouse: Shift+Left-click & drag
- 1-Button Mouse: Shift+Left-click & drag
Rotate in 3D Viewers
- Windows, Mac & Linux with
- 3-Button Mouse: Left-click & drag
- 2-Button Mouse: Left-click & drag
- 1-Button Mouse: Left-click & drag
User FAQ: User Interface
How to overlay 2 volumes ?
- Load the two volumes
- Use the slice viewer controls to select one of the volumes as the foreground and one as the background.
- Change the opacity of the Foreground to your liking.
- If you click on the link symbol, this happens to all viewers
How to load data from a sequence of jpg, tif, or png files?
- Choose from the menu: File / Add Data
- Click Choose File(s) to Add button and select any of the files in the sequence in the displayed dialog
- Click on Show Options and uncheck the Single File option
- Click OK to load the volume
- Go to the Volumes module
- Choose the loaded image as Active Volume
- In the Volume Information section set the correct Image Spacing and Image Origin values
- Most modules require grayscale image as input. The loaded color image can be converted to a grayscale image by using the Vector to scalar volume module
