Home < Slicer4:VisualBlogBack to Slicer 4 Documentation
- 2012
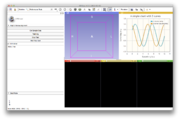
A ChartView using QWebView and jqPlot with plots defined in MRML
A ChartView using QWebView and jqPlot with plots defined in MRML
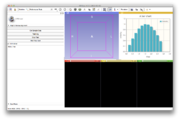
A bar chart tie MRML to a QWebView
- 2011
ChangeTracker visualization of analysis results
Volumerendering of a CT angiogram
Volumerendering of a subvolume of a post Gadolinium T1 weighted image of a GBM. Note the relation of surrounding vessels to the tumor.
Note the deformation of the corpus callosum fibers
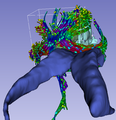
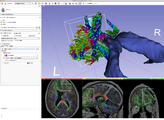
Using an ROI to crop streamlines from a whole brain tractography. The streamlines display color by orientation, the ellipsoids are displaying fractional anisotropy.
Annotation module 2011-11
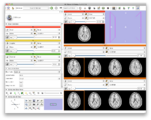
Main Gui with pop-up slice controllers
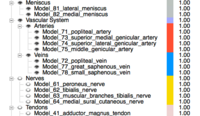
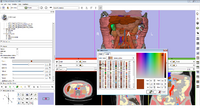
Models organized in a hierarchy
Dual camera, dual 3D viewer
After the facelift for the GUI
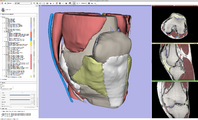
New models module appearance
Slicer4 with Volume Rendering
Slicer4 Annotation Module
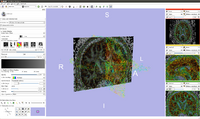
Glyph display on cross-sections
First CompareView in Slicer4 2011
Slicer 4 Annotation Module 2011-01-24
Slicer 4 Annotation Module 2011-01-24
Slicer 4 Live ultrasound module for IGT spine procedures
Slicer 4 Live ultrasound module for IGT prostate procedures
- 2010
Slicer 4 Annotation Module
