Documentation/Nightly/Extensions/SlicerAstro
|
For the latest Slicer documentation, visit the read-the-docs. |
Introduction and Acknowledgements
Authors:
Davide Punzo (Kapteyn Astronomical Institute, University of Groningen)
Thijs van der Hulst (Kapteyn Astronomical Institute, University of Groningen)
Jos Roerdink (Johann Bernoulli Institute for Mathematics and Computer Science, University of Groningen)
Contributors:
Jean-Christophe Fillion-Robin (Kitware)
Steve Pieper (Isomics)
Andras Lasso (PerkLab, Queen's)
Acknowledgements:
This work was supported by the European Research Council under the European Union's Seventh Framework Programme (FP/2007-2013)/ERC Grant Agreement nr. 291-531.
Contacts:
- Davide Punzo, <email>punzodavide@hotmail.it</email>; <email>D.Punzo@astro.rug.nl</email>
- Thijs van der Hulst, <email>J.M.van.der.Hulst@astro.rug.nl</email>
- Jos Roerdink <email>j.b.t.m.roerdink@rug.nl</email>
Source: [1]
License: Slicer license
Download/install: install 3D Slicer, start 3D Slicer, open the Extension Manager, install the SlicerAstro extension[2].
Extension Description
|
Upcoming HI (neutral Hydrogen) surveys will deliver large datasets, and automated processing using the full 3-D information (two positional dimensions and one spectral dimension) to find and characterize HI objects is imperative. In this context, visualization is an essential tool for enabling qualitative and quantitative human control on an automated source finding and analysis pipeline. Visual Analytics, the combination of automated data processing and human reasoning, creativity and intuition, supported by interactive visualization, enables flexible and fast interaction with the 3-D data, helping the astronomer to deal with the analysis of complex sources. 3-D visualization, coupled to modeling, provides additional capabilities helping the discovery and analysis of subtle structures in the 3-D domain. Objective: general description
|
Modules
SlicerAstro development focuses on HI datasets. The Astro Volume component is the core module and handles the loading/saving, color functions and WCS corrdinates. Tutorials and information can be found in the Astro Welcome module and sample data are available at the Astro Sample Data module. We currently provide additional modules with their own interface widgets for user interaction, which are mainly aimed for the analysis of HI data-cubes:- SlicerAstro Data Probe
- Astro Statistics
- Astro Masking
- Astro Smoothing
- Astro Profiles
- Astro Moment Maps
- Astro PV Slice
- Astro PV Diagram
- Astro Modeling
Use Cases
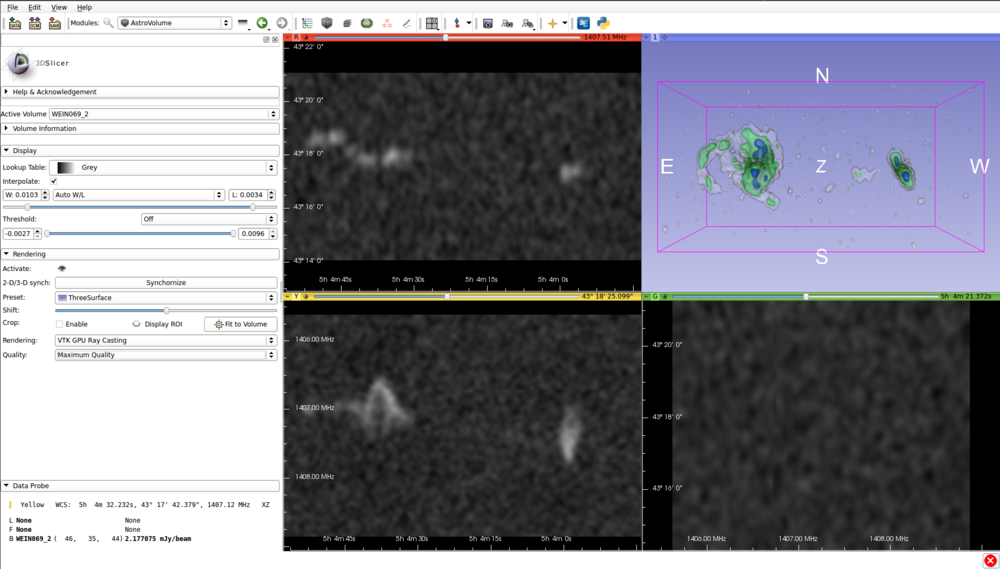
Visualization of HI dataset
Use of 3D visualization for the inspection and analysis of complex HI source. A 3D view gives an immediate overview of the coherence along the spatial and velocity dimensions such as tidal tail, gas stripping and filaments.
NOTE: SlicerAstro can potentially enhance also the inspection of other datasets such as mm/submm molecular line data and optical integral field spectroscopic data. The user is welcome to share any idea and feedback in the issue tracker[6].

References
How to cite
Please cite the following paper when referring to SlicerAstro in your publication:
@MISC{SlicerAstro,
   author = {{Punzo}, D. and {van der Hulst}, T. and {Roerdink}, J. and {Fillion-Robin}, J.-C.
	},
    title = "{SlicerAstro: Astronomy (HI) extension for 3D Slicer}",
 keywords = {Software },
howpublished = {Astrophysics Source Code Library},
     year = 2016,
    month = nov,
archivePrefix = "ascl",
   eprint = {1611.021},
}
@ARTICLE{2017A&C....19...45P,
   author = {{Punzo}, D. and {van der Hulst}, J.~M. and {Roerdink}, J.~B.~T.~M. and
	{Fillion-Robin}, J.~C. and {Yu}, L.},
    title = "{SlicerAstro: A 3-D interactive visual analytics tool for HI data}",
  journal = {Astronomy and Computing},
archivePrefix = "arXiv",
   eprint = {1703.06651},
 primaryClass = "astro-ph.IM",
 keywords = {Radio lines: galaxies, Scientific visualization, Visual analytics, Agile software development, Object oriented development, Empirical software validation},
     year = 2017,
    month = apr,
   volume = 19,
    pages = {45-59},
      doi = {10.1016/j.ascom.2017.03.004},
}
@ARTICLE{2015A&C....12...86P,
   author = {{Punzo}, D. and {van der Hulst}, J.~M. and {Roerdink}, J.~B.~T.~M. and {Oosterloo}, T.~A. and {Ramatsoku}, M. and {Verheijen}, M.~A.~W.},
    title = "{The role of 3-D interactive visualization in blind surveys of H I in galaxies}",
  journal = {Astronomy and Computing},
archivePrefix = "arXiv",
   eprint = {1505.06976},
 primaryClass = "astro-ph.IM",
 keywords = {Radio lines: galaxies, Galaxies: kinematics and dynamics, Surveys, Scientific visualization, Visual analytics},
     year = 2015,
    month = sep,
   volume = 12,
    pages = {86-99},
      doi = {10.1016/j.ascom.2015.05.004},
}
