Documentation/Nightly/Modules/DSC MRI Analysis
|
For the latest Slicer documentation, visit the read-the-docs. |
Introduction and Acknowledgements
| |||||||
|
Module Description
Dynamic Susceptibility Contrast (DSC) MRI imaging is an important functional imaging method that enables quantitative assessment of tissue hemodynamic patterns. Abnormality of blood flow, volume and permeability is frequently observed during tumor growth, and characterization of these perfusion attributes has become clinically important for both diagnosis and therapy planning. In the context of glial neoplasms, perfusion characteristics have been shown to correlate with tumor type and grade and hence influence treatment decisions.
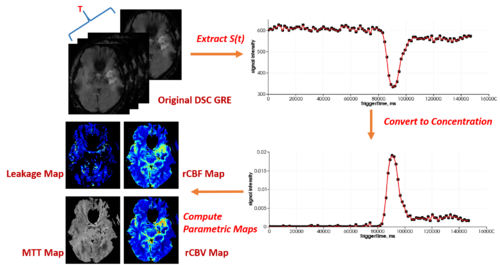
DSC MRI imaging is based on the principle that flow of a paramagnetic contrast agent through a capillary bed will transiently change the magnetic susceptibility of the given tissue. Decreased signal intensity on spin-echo or gradient-echo images after the first pass of the contrast agent, frequently described as susceptibility-induced T2* shortening, is the result of this temporal change in magnetic susceptibility. This signal time curve is then converted into a concentration time curve, and use of tracer kinetic analysis various hemodynamic variables, such as cerebral blood volume, cerebral blood flow, and mean transit time, as well as metrics that address vessel leakage may be estimated. Combined, these metrics enable microvascular imaging, providing a visual correlate of blood flow, volume, and vessel permeability.
Use Cases
- Estimation of quantitative parameters(rCBV,rCBF and MTT) from DSC MRI.
- Guide diagnosis, prognosis and therapy planning.
- Brain Tumor, Stroke, Adrenoleukodystrophy and other diseases.
Tutorials
Panels and their use
|
Similar Modules
References
- Introduction of DSC MRI from Siemens
- Equations for conversion of signal to concentration for DSC
- Other method to investigate DSC MRI
Information for Developers
| Section under construction. |


