Difference between revisions of "Documentation/Nightly/Modules/AstroPVSlice"
From Slicer Wiki
| Line 25: | Line 25: | ||
{{documentation/{{documentation/version}}/module-section|Module Description}} | {{documentation/{{documentation/version}}/module-section|Module Description}} | ||
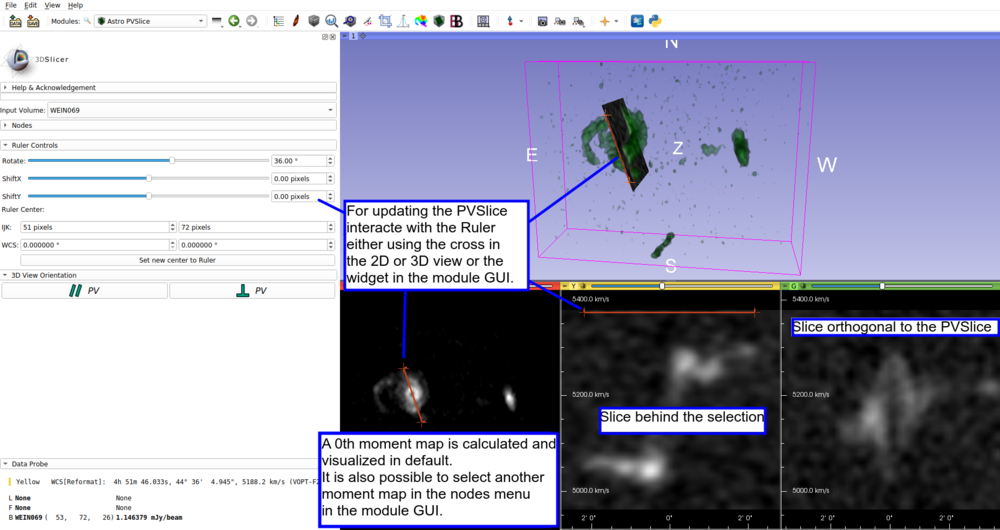
AstroPVSlice module visualize Position Velocity (PV) Slices by providing customized controls over the GUI. This module provides a fast inspection tool with a PVSlice linked both with the 2D and 3D views. | AstroPVSlice module visualize Position Velocity (PV) Slices by providing customized controls over the GUI. This module provides a fast inspection tool with a PVSlice linked both with the 2D and 3D views. | ||
| − | For creating PV Diagram (e.g., creating a curvilinear PV and save it as fits file), please use the | + | For creating PV Diagram (e.g., creating a curvilinear PV and save it as fits file), please use the [[Documentation/{{documentation/version}}/Modules/AstroPVDiagram|Astro PV Diagram]] module. |
<!-- ---------------------------- --> | <!-- ---------------------------- --> | ||
Revision as of 14:24, 14 February 2018
Home < Documentation < Nightly < Modules < AstroPVSlice
|
For the latest Slicer documentation, visit the read-the-docs. |
Introduction and Acknowledgements
|
Authors: Acknowledgements: Contacts:
|
Module Description
AstroPVSlice module visualize Position Velocity (PV) Slices by providing customized controls over the GUI. This module provides a fast inspection tool with a PVSlice linked both with the 2D and 3D views. For creating PV Diagram (e.g., creating a curvilinear PV and save it as fits file), please use the Astro PV Diagram module.
Panels and their use
References
@ARTICLE{2017A&C....19...45P,
   author = {{Punzo}, D. and {van der Hulst}, J.~M. and {Roerdink}, J.~B.~T.~M. and
	{Fillion-Robin}, J.~C. and {Yu}, L.},
    title = "{SlicerAstro: A 3-D interactive visual analytics tool for HI data}",
  journal = {Astronomy and Computing},
archivePrefix = "arXiv",
   eprint = {1703.06651},
 primaryClass = "astro-ph.IM",
 keywords = {Radio lines: galaxies, Scientific visualization, Visual analytics, Agile software development, Object oriented development, Empirical software validation},
     year = 2017,
    month = apr,
   volume = 19,
    pages = {45-59},
      doi = {10.1016/j.ascom.2017.03.004},
}

