Difference between revisions of "Documentation/4.1/Developers/Charts"
From Slicer Wiki
| Line 71: | Line 71: | ||
cn.SetProperty('default', 'yAxisLabel', 'Something in y') | cn.SetProperty('default', 'yAxisLabel', 'Something in y') | ||
| + | # Tell the Chart View which Chart to display | ||
cvn.SetChartNodeID(cn.GetID()) | cvn.SetChartNodeID(cn.GetID()) | ||
</pre> | </pre> | ||
Revision as of 17:02, 6 June 2012
Home < Documentation < 4.1 < Developers < ChartsContents
Slicer Charting Overview
Slicer provides Charting facilities that include a special Chart View that can be packed in the layout, similar to the Slice Views and 3D Views. The architecture also includes nodes that represent the data to be displayed in the chart as well as nodes to represent the display properties of the data and the chart itself.
Chart capabilities
Chart View
- qMRMLChartWidget
- The toplevel charting widget that is packed in layout. Subclass of qMRMLWidget. Contains a qMRMLChartView and a qMRMLChartViewControllerWidget. There can be several Chart Widgets in a single layout.
- qMRMLChartView
- Display canvas of the chart. This is currently a subclass of QWebView as the charting facilities is based on a jQuery library called jqPlot.
- qMRMLChartViewControllerWidget
- Widget to control the content and display of a chart.
MRML Nodes
- vtkMRMLChartViewNode
- Node associated with a Chart View. Keeps track of which chart to display in a Chart View. There can be multiple charts in a scene and a given Chart View can display any of the charts.
- vtkMRMLChartNode
- Represents the content and properties of a chart. Manages a list of Array Nodes to display in the chart. Provides methods to set the properties of a chart or the properties of each Array Node.
- vtkMRMLDoubleArrayNode
- Represents the data that can be displayed in a chart. Array nodes contain a series of 3-tuples representing the (X, Y, Error) measurement values.
Constructing a chart
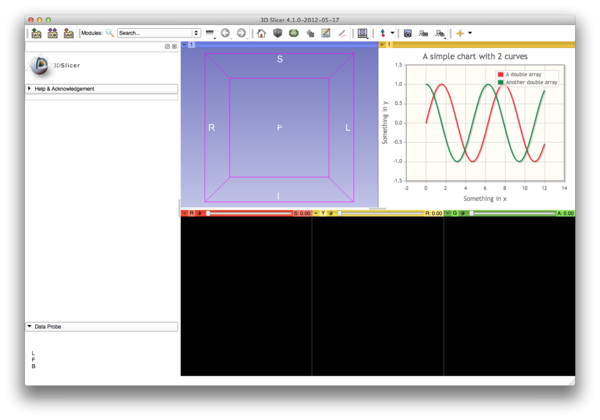
Below is an example in python to construct and display a chart communicating completely at the level of MRML.
import slicer
import math

# Switch to a layout (24) that contains a Chart View to initiate the construction of the widget and Chart View Node
lns = slicer.mrmlScene.GetNodesByClass('vtkMRMLLayoutNode')
lns.InitTraversal()
ln = lns.GetNextItemAsObject()
ln.SetViewArrangement(24)

# Get the Chart View Node
cvns = slicer.mrmlScene.GetNodesByClass('vtkMRMLChartViewNode')
cvns.InitTraversal()
cvn = cvns.GetNextItemAsObject()

# Create an Array Node and add some data
dn = slicer.mrmlScene.AddNode(slicer.vtkMRMLDoubleArrayNode())
a = dn.GetArray()
a.SetNumberOfTuples(600)
x = range(0, 600)
for i in range(len(x)):
    a.SetComponent(i, 0, x[i]/50.0)
    a.SetComponent(i, 1, math.sin(x[i]/50.0))
    a.SetComponent(i, 2, 0)

# Create a second Array node
dn2 = slicer.mrmlScene.AddNode(slicer.vtkMRMLDoubleArrayNode())
a = dn2.GetArray()
a.SetNumberOfTuples(600)
x = range(0, 600)
for i in range(len(x)):
    a.SetComponent(i, 0, x[i]/50.0)
    a.SetComponent(i, 1, math.cos(x[i]/50.0))
    a.SetComponent(i, 2, 0)

# Create a Chart Node.
cn = slicer.mrmlScene.AddNode(slicer.vtkMRMLChartNode())

# Add the Array Nodes to the Chart. The first argument is a string used for the legend and to refer to the Array when setting properties.
cn.AddArray('A double array', dn.GetID())
cn.AddArray('Another double array', dn2.GetID())

# Set a few properties on the Chart. The first argument is a string identifying which Array to assign the property.
# 'default' is used to assign a property to the Chart itself (as opposed to an Array Node).
cn.SetProperty('default', 'title', 'A simple chart with 2 curves')
cn.SetProperty('default', 'xAxisLabel', 'Something in x')
cn.SetProperty('default', 'yAxisLabel', 'Something in y')

# Tell the Chart View which Chart to display
cvn.SetChartNodeID(cn.GetID())
This code produces the chart below.
