|
|
| Line 1: |
Line 1: |
| | + | This is the Slicer 4 visual blog. Pleae click [[Slicer3:VisualBlog| here]] if you are looking for the old Slicer 3 visual blog. |
| | + | |
| | <gallery caption="2012" widths="200px" perrow="4"> | | <gallery caption="2012" widths="200px" perrow="4"> |
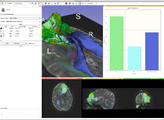
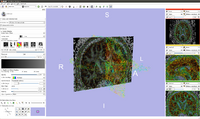
| | Image:Screen Shot 2012-05-30 at 8.03.23 AM.png| Color Fibers by mean orientation is now available in the Tractography Display module | | Image:Screen Shot 2012-05-30 at 8.03.23 AM.png| Color Fibers by mean orientation is now available in the Tractography Display module |
Revision as of 12:09, 30 May 2012
Home < Slicer4:VisualBlogThis is the Slicer 4 visual blog. Pleae click here if you are looking for the old Slicer 3 visual blog.
- 2012
Color Fibers by mean orientation is now available in the Tractography Display module
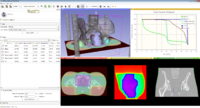
SlicerRT 0.2 has been released! SlicerRT is 3D Slicer with extensions for radiotherapy research, which is developed by SparKit project with the contributions from Slicer community.
The new extension manager
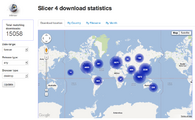
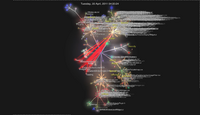
Up to date download statistics
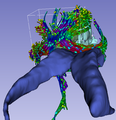
A combination of ROI cropping of streamlines, fiducial based seeding and labelmap seeding allows to assess the deformation of streamlines which are due to tumor based deformations.
New download page which highlights the operating system of the downloading system.
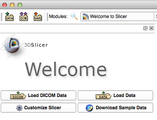
New look for the Welcome module and the "Load/Save" toolbar
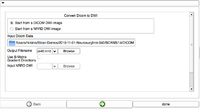
Step one of the DWI to Full-brain tractography wizard
Improved 2-stage user interface for the Slice Viewer Controllers
Updated Icons for the Core Modules
Updated CompareViewers and Viewer Controler Module
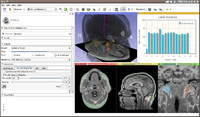
MultiVolumeExplorer with support for charting. See here for more information.
Image Quantification with Label Statistics, Charting, and Volume Rendering
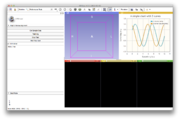
A ChartView using QWebView and jqPlot with plots defined in MRML
A ChartView using QWebView and jqPlot with plots defined in MRML
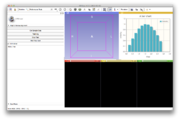
A bar chart tie MRML to a QWebView
- 2011
ChangeTracker visualization of analysis results
Volumerendering of a CT angiogram
Volumerendering of a subvolume of a post Gadolinium T1 weighted image of a GBM. Note the relation of surrounding vessels to the tumor.
Note the deformation of the corpus callosum fibers
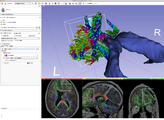
Using an ROI to crop streamlines from a whole brain tractography. The streamlines display color by orientation, the ellipsoids are displaying fractional anisotropy.
Annotation module 2011-11
Main Gui with pop-up slice controllers
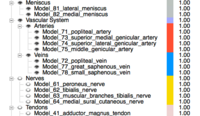
Models organized in a hierarchy
Dual camera, dual 3D viewer
After the facelift for the GUI
New models module appearance
Slicer4 with Volume Rendering
Slicer4 Annotation Module
Glyph display on cross-sections
First CompareView in Slicer4 2011
Slicer 4 Annotation Module 2011-01-24
Slicer 4 Annotation Module 2011-01-24
Slicer 4 Live ultrasound module for IGT spine procedures
Slicer 4 Live ultrasound module for IGT prostate procedures
- 2010
Slicer 4 Annotation Module

