Difference between revisions of "Documentation/4.1/Modules/MultiVolumeExplorer"
From Slicer Wiki
| Line 43: | Line 43: | ||
Most frequently used for these scenarios: | Most frequently used for these scenarios: | ||
* visualization of a DICOM dataset that contains multiple frames that can be separated based on some tag (e.g., DCE MRI data, where individual temporally resolved frames are identified by Trigger Time tag (0018,1060) | * visualization of a DICOM dataset that contains multiple frames that can be separated based on some tag (e.g., DCE MRI data, where individual temporally resolved frames are identified by Trigger Time tag (0018,1060) | ||
| − | * visualization of multiple frames defined in the same coordinate frame, saved as individual volumes in NRRD, NIfTI, or any other [[image format supported by 3D Slicer]] | + | * visualization of multiple frames defined in the same coordinate frame, saved as individual volumes in NRRD, NIfTI, or any other [[Documentation/4.1/SlicerApplication/SupportedDataFormat|image format supported by 3D Slicer]] |
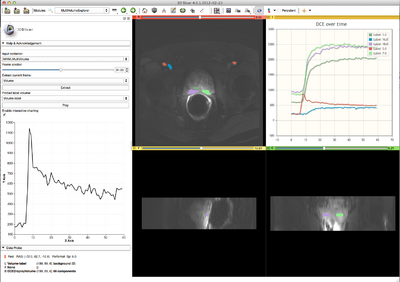
[[Image:Screen_Shot_2012-02-23_at_7.53.51_AM.png|400px|thumb|Screenshot of charts derived from the sample data set. The curves represent average signal intensity in the ROI's with corresponding colors, which were drawn in the editor. Please note the arterial input function in red.]] | [[Image:Screen_Shot_2012-02-23_at_7.53.51_AM.png|400px|thumb|Screenshot of charts derived from the sample data set. The curves represent average signal intensity in the ROI's with corresponding colors, which were drawn in the editor. Please note the arterial input function in red.]] | ||
Revision as of 22:01, 30 April 2012
Home < Documentation < 4.1 < Modules < MultiVolumeExplorer| Page under construction. |
WARNING: This module is Work in Progress, which means:
|
Introduction and Acknowledgements
|
This work is supported by NA-MIC, NAC, NCIGT, and the Slicer Community. This work is partially supported by the following grants: P41EB015898, P41RR019703, R01CA111288 and U01CA151261. | |||||||||||
|
Module Description
This module provides support for exploring multivolume (multiframe) data.
Use Cases
Most frequently used for these scenarios:
- visualization of a DICOM dataset that contains multiple frames that can be separated based on some tag (e.g., DCE MRI data, where individual temporally resolved frames are identified by Trigger Time tag (0018,1060)
- visualization of multiple frames defined in the same coordinate frame, saved as individual volumes in NRRD, NIfTI, or any other image format supported by 3D Slicer
Tutorials
- Screencast tutorial (note that the module is located in Modules -> Work in progress -> MultiVolume Support, not in Modules -> MultiVolume Support, as shown in the video)
- Sample datasets are available:
- anonymized prostate DCE MRI DICOM series
- File:Cardiac ECGg CT.tgz (ECG-gated contrast-enhanced cardiac CT) (use "User-defined non-DICOM" parameter option to load it into MultiVolumeImporter). Short movie
Panels and their use
Similar Modules
N/A
References
- Development of this module was initiated at the 2012 NA-MIC Project week at SLC (see http://wiki.na-mic.org/Wiki/index.php/2012_Project_Week:4DImageSlicer4)
Information for Developers
| Section under construction. |
Known issues that won't be resolved
- bug 1841: multivolumes that contain less than 7 frames will not be saved correctly and the scene containing such objects will not be loaded correctly by Slicer (limitation of the NRRD IO for DWI)
Unresolved issues
- assign correctly title and points for the X axis
- review the comments from JC/J2 on github and fix the code
- bug: repeated loading of a scene that contains a MV node causes crash in onInputChanged()
- improve error reporting!
- look into flickering issue of vtkChart
- improve documentation
Features to be implemented
- integrate MV importer as a DICOM module plugin
- allow the user to speed-up or slow-down the playback, and also turn off "loop"
- report to the user the actual, measured, frame rate
- add an option to report curves in relative SI change in addition to absolute
Features under consideration
- can we use chart viewer for interactive plotting? -- Discussed with Jim, speedup is possible, but not a priority right now
- should use color names for the legend in the chart viewer -- Will be available as general feature of Charts (Jim)
- interactive update of the active frame based on the point selected in the chart viewer
- should DWI node be a child under the MV hierarchy?
- add GUI elements to update the current frame at the exact time intervals specified in multivolume. If the intervals are non-uniform, I am not sure I can use the timer anymore, so this would require some extra thought.
- import multivolumes from ITK 4d images


