Difference between revisions of "Documentation/4.1/Modules/MultiVolumeExplorer"
| Line 22: | Line 22: | ||
Unresolved issues: | Unresolved issues: | ||
* general | * general | ||
| + | ** widget should be reorganized and improved for explorer module | ||
** review the comments from JC/J2 on github and fix the code | ** review the comments from JC/J2 on github and fix the code | ||
** add testing | ** add testing | ||
| − | |||
| − | |||
| − | |||
** BUG: need to be in quantitative layout on startup, otherwise charting does not work -- FIXED | ** BUG: need to be in quantitative layout on startup, otherwise charting does not work -- FIXED | ||
** BUG: frames were not sorted on load, sometimes causing incorrect initialization of the multivolume -- FIXED | ** BUG: frames were not sorted on load, sometimes causing incorrect initialization of the multivolume -- FIXED | ||
Revision as of 18:08, 25 February 2012
Home < Documentation < 4.1 < Modules < MultiVolumeExplorer| Page under construction. |
This is a placeholder for MultiVolumeExplorer module documentation.
Development of this module was initiated at the 2012 NA-MIC Project week at SLC (see http://wiki.na-mic.org/Wiki/index.php/2012_Project_Week:4DImageSlicer4)
The module is located in Modules -> Work in progress -> MultiVolume Support
Disclaimer: this module is Work in progress. This means that
- the functionality provided by this module may change drastically in the future releases of 3D Slicer
- the scenes containing data types specific to this module may not be readable by the future versions of Slicer
- the functionality and user interface may change at any time
- some functionality may not work as intended
- testing and documentation is limited
If you would like to try this module:
- download the sample dataset File:Case1 DCE.tgz (anonymized prostate DCE MRI DICOM series)
- check out this screencast if you would like to learn how to use this module. (The module is located in Modules -> Work in progress -> MultiVolume Support, not in Modules -> MultiVolume Support, as shown in the video)
Unresolved issues:
- general
- widget should be reorganized and improved for explorer module
- review the comments from JC/J2 on github and fix the code
- add testing
- BUG: need to be in quantitative layout on startup, otherwise charting does not work -- FIXED
- BUG: frames were not sorted on load, sometimes causing incorrect initialization of the multivolume -- FIXED
- assign more intuitive names to the extracted frames -- DONE
- look why DWI appears on the list of scalar volumes -- FIXED
- look into flickering issue of vtkChart
- assign correctly title and points for the X axis
- look into why the chart view node is not recognized if the quantitative layout is not used initially -- FIXED
- can we use chart viewer for interactive plotting? -- Discussed with Jim, speedup is possible, but not a priority right now
- should use color names for the legend in the chart viewer -- Will be available as general feature of Charts (Jim)
Features under consideration:
- interactive update of the active frame based on the point selected in the chart viewer
- should DWI node be a child under the MV hierarchy?
Introduction and Acknowledgements
|
This work is supported by NA-MIC, NAC, NCIGT, and the Slicer Community. This work is partially supported by TODO. | |||||||||
|
Module Description
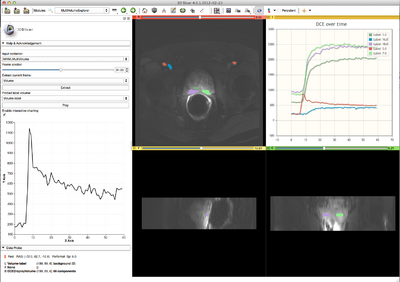
This module provides support for exploring multivolume (multiframe) data.
Use Cases
Most frequently used for these scenarios:
- visualization of DCE MRI
Tutorials
Panels and their use
Similar Modules
N/A
References
Information for Developers
| Section under construction. |


