Difference between revisions of "Modules:FourDAnalysis-Documentation-3.5"
(→Usage) |
|||
| Line 38: | Line 38: | ||
===Quick Tour of Features and Use=== | ===Quick Tour of Features and Use=== | ||
| − | * '''Frame Control:''' | + | * '''Active 4D Bundle:''' Specify the active 4D image series. |
| − | * ''' | + | * '''Frame Control:''' View the 4D image data. 4D images can be loaded from [[Modules:FourDImage-Documentation-3.5| 4D Image Module]] |
| − | * ''' | + | * '''Intensity Plot:''' Generate intensity curves and display them on this panel. The curves are measured for each labeled region in the specified label map. If the label map contains multiple labels, the module generates intensity curve for each label. The user can also load/save curves from/to CSV files. |
| − | * ''' | + | * '''Model/Parameter:''' Select Python script and parameters for pharmacokinetic analysis. |
| + | * '''Curve Fitting:''' Perform a single curve fitting. It displays the result parameters. | ||
| + | * '''Parameter Map:''' Generate parameter map. The module performs curve fitting for each voxel in the specified region. | ||
== Development == | == Development == | ||
Revision as of 15:16, 3 September 2009
Home < Modules:FourDAnalysis-Documentation-3.5Return to Slicer 3.5 Documentation
Module Name
4D Analysis Module
General Information
Module Type & Category
Type: Interactive
Category: 4D
Authors, Collaborators & Contact
- Junichi Tokuda, Ph.D., Brigham and Women's Hospital
- Hiroto Hatabu, M.D., Ph.D., Brigham and Women's Hospital
- Contact: Junichi Tokuda, tokuda at bwh.harvard.edu
Module Description
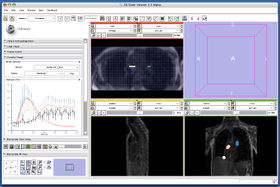
The 4D Analysis Module allows you to analyze a time-series of 3D images (4D image) on 3D Slicer. Currently, the module offers the following functions:
- Intensity plot. The module can draw intensity curves at the specified regions of interest.
- Pharmacokinetic model analysis. The users can perform pharmacokinetic model analysis based on the intensity curves. Models are defined in Python scripts so that the users can modify the existing models or create their own pharmacokinetic models.
- Parameter map. The module also allows generating a map of pharmacokinetic parameters.
Usage
Examples, Use Cases & Tutorials
- Plot intensity change at the specified region.
- Analyzing DCE MRI using pharmacokinetic models e.g. Tofts model etc.
Quick Tour of Features and Use
- Active 4D Bundle: Specify the active 4D image series.
- Frame Control: View the 4D image data. 4D images can be loaded from 4D Image Module
- Intensity Plot: Generate intensity curves and display them on this panel. The curves are measured for each labeled region in the specified label map. If the label map contains multiple labels, the module generates intensity curve for each label. The user can also load/save curves from/to CSV files.
- Model/Parameter: Select Python script and parameters for pharmacokinetic analysis.
- Curve Fitting: Perform a single curve fitting. It displays the result parameters.
- Parameter Map: Generate parameter map. The module performs curve fitting for each voxel in the specified region.
Development
Installation
Although the module's source directory is in the trunk repository, it is not included in the CMake configuration. To use 4D Analysis Module, you need edit Slicer3/Modules/CMakeLists.txt and build the module.
(Supposing you have your local copy of 3D SLicer under <working directory>, in the following instruction)
1. Edit Slicer3/Modules/CMakeLists.txt
In subdirs section, insert 'FourDAnalysis' as:
subdirs(
  MRIBiasFieldCorrection

  ...

  FastMarchingSegmentation
  FourDImage
  FourDAnalysis                                # <- Here!!
  ExtractSubvolumeROI

  ...
  )
2. Build the module
In Linux or Mac OS X,
cd <working directory>/Slicer3-build/Modules
make
In Windows, open the project file in <working directory>/Slicer3-build/Modules, and build all.
3. Check the module
If the module has been built successfully, it shows up in the '4D' section in the module selection list.
Dependencies
The intensity curve analysis functions depend on SciPy package. Please turn on SciPy option when you build your 3D Slicer.
Known bugs
Follow this link to the Slicer3 bug tracker.
Usability issues
Follow this link to the Slicer3 bug tracker. Please select the usability issue category when browsing or contributing.
Source code & documentation
Customize following links for your module.
Links to documentation generated by doxygen.
More Information
2D Graph
The module provides a set of classes to support 2D Graph for intensity curve plotting, which can potentially be used for other projects. Please refer Slicer3:2DPlotting for more detail.
Acknowledgment
This work is supported by NIH (5R21CA116271: Dynamic contrast-enhanced MRI of pulmonary nodule at 3T, PI: Hiroto Hatabu), NA-MIC, and NCIGT.
