Difference between revisions of "Modules:FourDAnalysis-Documentation-3.5"
| Line 71: | Line 71: | ||
===Acknowledgment=== | ===Acknowledgment=== | ||
| − | + | This work is supported by NIH (5R21CA116271: Dynamic contrast-enhanced MRI of pulmonary nodule at 3T, PI: Hiroto Hatabu), NA-MIC, and NCIGT. | |
===References=== | ===References=== | ||
Publications related to this module go here. Links to pdfs would be useful. | Publications related to this module go here. Links to pdfs would be useful. | ||
Revision as of 16:03, 16 June 2009
Home < Modules:FourDAnalysis-Documentation-3.5Return to Slicer 3.5 Documentation
Module Name
4D Analysis Module
General Information
Module Type & Category
Type: Interactive
Category: 4D
Authors, Collaborators & Contact
- Junichi Tokuda, Ph.D., Brigham and Women's Hospital
- Hiroto Hatabu, M.D., Ph.D., Brigham and Women's Hospital
- Contact: Junichi Tokuda, tokuda at bwh.harvard.edu
Module Description
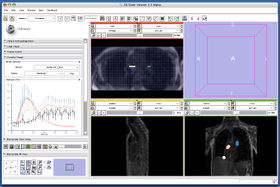
The 4D Analysis Module allows you to load, visualize and analyze a time-series of 3D images (4D image) on 3D Slicer. Currently, the module offers the following functions:
- 4D image loader. The module can load up a series of 3D images from a specified directory. It analyzes DICOM header of the files in the directory and split them into time-frames, even if all frames have the same series number (some MRI scanners generates time-series images without incrementing series number, resulting a large number (typically several thousands) of 2D image files output in a single directory). The module can also read a directory, which contains NRRD files.
- Time scroll. The module provides a scroll-bar interface to scroll the frame in time-direction. It allows you to scroll the frame for foreground and background screens independently to compare two images at the different time points.
- Intensity plot. The module can draw intensity curve at the specified region of interest.
- Series registration. The module provides a user-interface to perform image registration for each frame with a key frame. This function is useful if you want to perform intensity curve analysis on a series of images of an organ moving through the frames.
Usage
Examples, Use Cases & Tutorials
- Note use cases for which this module is especially appropriate, and/or link to examples.
- Link to examples of the module's use
- Link to any existing tutorials
Quick Tour of Features and Use
List all the panels in your interface, their features, what they mean, and how to use them. For instance:
- Input panel:
- Parameters panel:
- Output panel:
- Viewing panel:
Development
Dependencies
Other modules or packages that are required for this module's use.
Known bugs
Follow this link to the Slicer3 bug tracker.
Usability issues
Follow this link to the Slicer3 bug tracker. Please select the usability issue category when browsing or contributing.
Source code & documentation
Customize following links for your module.
Links to documentation generated by doxygen.
More Information
Acknowledgment
This work is supported by NIH (5R21CA116271: Dynamic contrast-enhanced MRI of pulmonary nodule at 3T, PI: Hiroto Hatabu), NA-MIC, and NCIGT.
References
Publications related to this module go here. Links to pdfs would be useful.
