Difference between revisions of "Slicer3:Python"
| Line 238: | Line 238: | ||
=== Non-interactive plot === | === Non-interactive plot === | ||
| + | <pre> | ||
try: | try: | ||
import matplotlib | import matplotlib | ||
| Line 270: | Line 271: | ||
imageWidget.setScaledContents(True) | imageWidget.setScaledContents(True) | ||
imageWidget.show() | imageWidget.show() | ||
| + | </pre> | ||
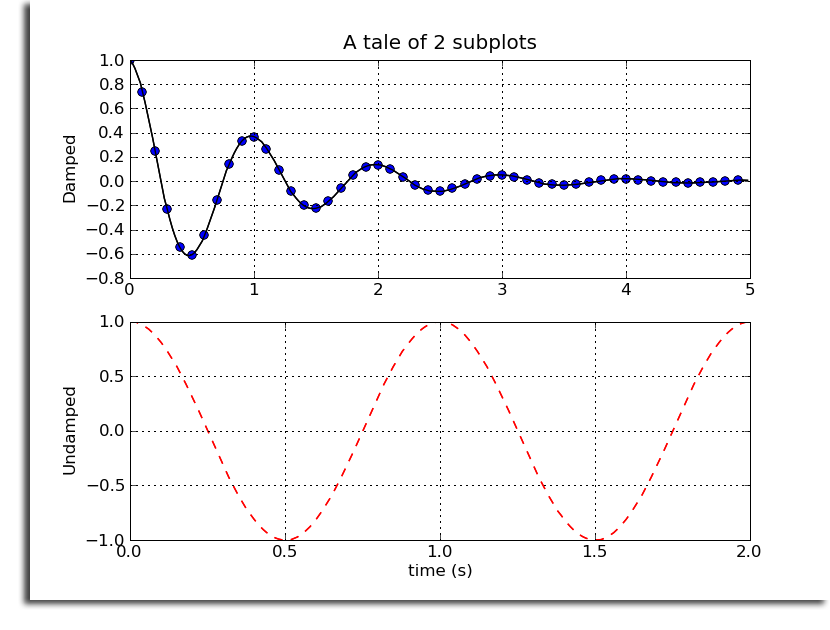
[[Image:MatplotlibExample.png]] | [[Image:MatplotlibExample.png]] | ||
| Line 275: | Line 277: | ||
=== Non-interactive plot in Jupyter notebook === | === Non-interactive plot in Jupyter notebook === | ||
| + | <pre> | ||
try: | try: | ||
import matplotlib | import matplotlib | ||
| Line 301: | Line 304: | ||
savefig('MatplotlibExample.png') | savefig('MatplotlibExample.png') | ||
display(filename='MatplotlibExample.png', type="image/png", binary=True) | display(filename='MatplotlibExample.png', type="image/png", binary=True) | ||
| + | </pre> | ||
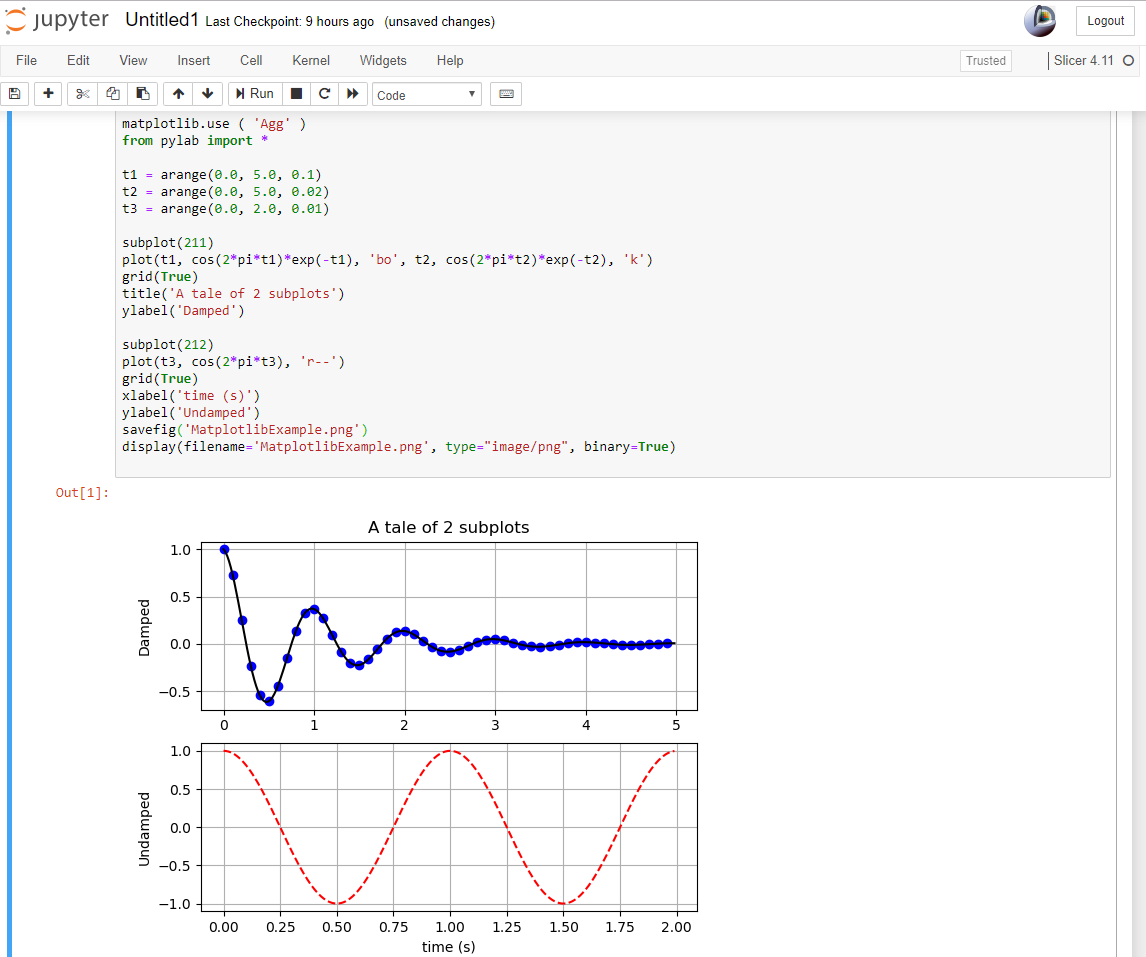
[[Image:JupyterNotebookMatplotlibExample.png]] | [[Image:JupyterNotebookMatplotlibExample.png]] | ||
| Line 306: | Line 310: | ||
=== Interactive plot using wxWidgets GUI toolkit === | === Interactive plot using wxWidgets GUI toolkit === | ||
| + | <pre> | ||
try: | try: | ||
import matplotlib | import matplotlib | ||
| Line 324: | Line 329: | ||
matplotlib.use('WXAgg') | matplotlib.use('WXAgg') | ||
| − | # Show | + | # Show an interactive plot |
import matplotlib.pyplot as plt | import matplotlib.pyplot as plt | ||
fig, ax = plt.subplots() | fig, ax = plt.subplots() | ||
| Line 331: | Line 336: | ||
ax.set_ylim((0, 4e5)) | ax.set_ylim((0, 4e5)) | ||
plt.show(block=False) | plt.show(block=False) | ||
| + | </pre> | ||
| + | |||
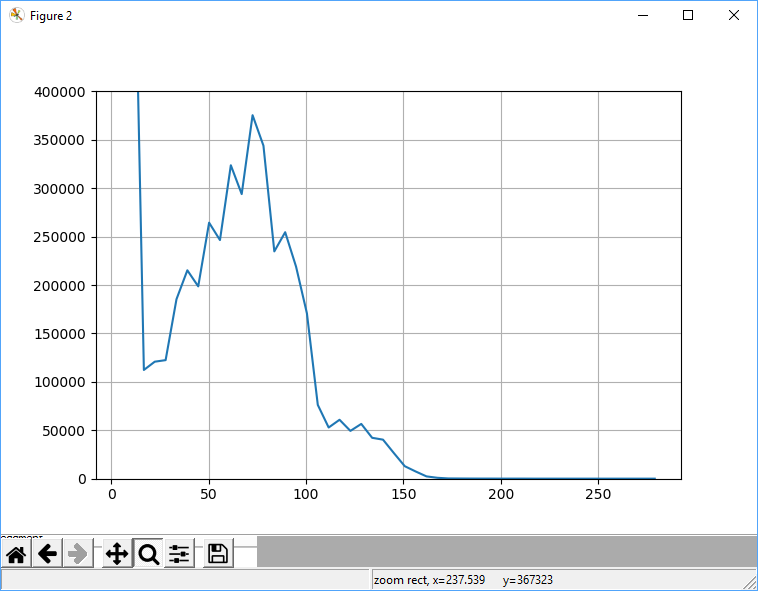
| + | [[Image:InteractiveMatplotlibExample.png]] | ||
== Where to go from here == | == Where to go from here == | ||
Revision as of 04:58, 7 September 2019
Home < Slicer3:PythonNote: this page describes the python interface in 3D Slicer version 3.x which is no longer the current release. For newer information, see the page describing the python interface to 3D Slicer 4.x.
Contents
Status of Python in Slicer
As of Slicer 3.4, python and numpy are enabled by default.
scipy and matplotlib are not enabled due to the difficulty in compiling binaries of them for distribution. It is possible for people to compile their own versions of scipy to install and use with a local copy of slicer. This is also true for many other python modules (see the ipython installation technique as an example that should work for other distutils based python code.)
Though matplotlib is still not properly interacting with Slicer3, NumPy and Python support should work well for all platforms. Python command line modules are well supported, as is building full GUI modules in Python.
Python for scientific computing
Python has a fairly comprehensive package for scientific computing called SciPy. Of main interest to Slicer users/developers is NumPy. NumPy provides most of the features of the Matlab image processing toolbox and numeric computations, but in an Open Source package. A compelling reason to use NumPy is the ease of interaction and integration with Slicer3.
Slicer3 and Python
Enabling Python in the Slicer Build
- Edit slicer_variables.tcl
- Change "set ::USE_PYTHON "off"" to "on"
- Optional: If you prefer to use your system Python installation, change set ::USE_SYSTEM_PYTHON "false" to "true"
- This will give an error under Linux and Windows, but it can be easily fixed by adding the system path for Python, just search for "if { $::USE_SYSTEM_PYTHON } {"
- Optional: installing SciPy
- Download the scipy egg for your platform
- Unzip the egg in any directory that is part of Slicer's Python path, eg Slicer3-build/lib/Slicer3/Plugins
- SciPy should now be available in Slicer's Python interpreter
Build Slicer3 using "getbuildtest.tcl", i.e.:
Macintosh:Slicer3 blezek$ Scripts/getbuildtest.tcl
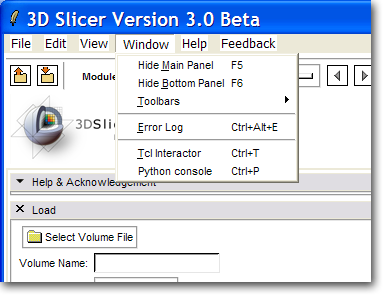
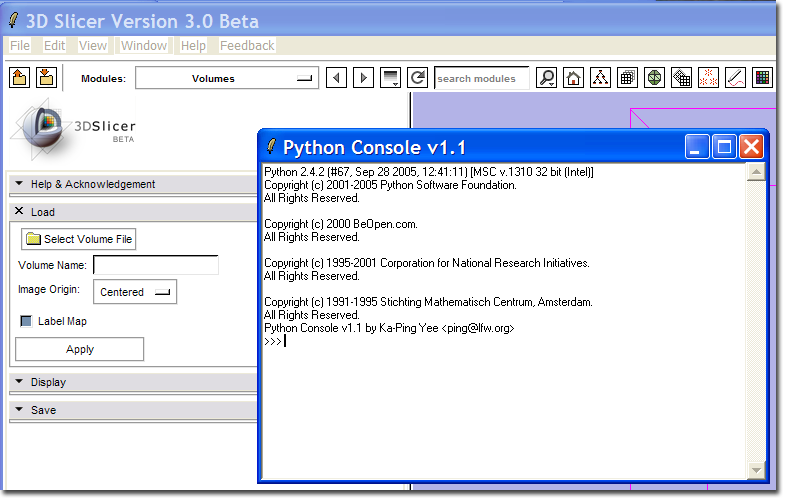
A new menu command Python Interpreter should appear on the Window menu.
This command should bring up the Python Console window.
Using System Python Libraries with Slicer's python
It is possible in many instances to use binary packages from the scipy site or from Enthought along with the pre-built slicer. The following works on the mac, for instance:
import sys
d = '/Library/Frameworks/Python.framework/Versions/2.5/lib/python2.5/site-packages/'
packages = ['matplotlib', 'neuroimaging', 'numpy', '', 'scipy']
for p in packages:
  sys.path.append(d+p)
Basic Slicer/Python tutorial
Note: this is initial documentation only, and is subject to change as the API evolves.
The Slicer Python interpreter has access to all Python modules referenced by the environment variable PYTHONPATH as well as the Slicer internal module. The Slicer module also supports the interface between Slicer Volume Nodes and NumPy. It would be instructive for the reader to review the NumPy documentation. For serious users of NumPy, there is the Guide to NumPy by Travis Oliphant for purchase.
The main interface to Slicer from Python is through the Slicer Python module. From there, the Python user can access any of Slicer's global objects and MRML tree. For example:
 >>> import Slicer
 >>> Slicer.slicer
 <Slicer.Slicer object at 0x9f325f0>
 >>> Slicer.slicer.MRMLScene.GetNumberOfNodesByClass ( 'vtkMRMLVolumeNode' )
 0
 >>>
In this case, no 'vtkMRMLVolumeNode's were loaded into Slicer.
VTK objects may be easily constructed, as well as any other object available from the C++ Slicer API.
>>> a = Slicer.slicer.vtkPolyData()
>>> help ( a )
Help on vtkPolyData in module Slicer object:

class vtkPolyData(vtkPointSet)
 |  Method resolution order:
 |      vtkPolyData
 |      vtkPointSet
 |      vtkDataSet
 <output truncated>
VTK objects created in this manner conform as closely as possible to the VTK Python bindings, but must be created through the slicer object inside the Slicer module. Each object may be fully subclassed following the meta object pattern.
A few details on Python in Slicer
Although it is possible to use Slicer within Python, enabling Python in a Slicer build does not trigger Python wrapping of C++ classes. Instead, Python has access to the Slicer API through Tcl. Whenever a constructor for an object is invoked, e.g.
from Slicer import slicer
surface = slicer.vtkPolyData()
to create a VTK object, or
modelNode = slicer.vtkMRMLModelNode()
to create a MRML node, the Python interpreter tells the Tcl interpreter to instantiate a vtkPolyData or vtkMRMLModelNode (this happens through the Tcl wrappers which are built as part of the basic Slicer) and makes it available to the Python interface. More in detail, Python asks Tcl to illustrate what is a vtkPolyData, what are the parent classes and the methods, creates the whole class hierarchy on the fly, and creates an instance of that object. When one calls an object's method, like
numberOfPoints = surface.GetNumberOfPoints()
the Python interpreter relays the call to the Tcl interpreter and returns the proper return value. Any object available to Tcl is the same object available to Python, and this allows for great flexibility, as everything lives in a common space.
Writing modules (especially interactive modules) in Python can lead to quite a speed up in the development cycle, since the code is more concise, requires less file shuffling and more than anything, it doesn't need to be recompiled (in some cases you don't even need to exit Slicer).
More than this, enabling Python in Slicer opens up the possibility of accessing a very wide range of Python libraries, such as Numpy and Scipy from within Slicer (either interactively or in modules), making Slicer use cases potentially explode.
NumPy tutorial
Python and NumPy give direct access to the volume data in Slicer by wrapping the image data in a NumPy array object through the .ToArray() method on the volume node. This tutorial assumes you have installed SciPy.
>>> # Access the image data directly
>>> from Slicer import slicer
>>> nodes = slicer.ListVolumeNodes()
>>> t2 = nodes['T2.hdr']
>>> data = t2.GetImageData().ToArray()
>>> print data
[[[ 0  0  0 ...,  0  0  0]
  [ 0  0  1 ...,  0  1  0]
  [ 0  0  0 ...,  0  0  0]
  ...,
  [ 0  8  0 ...,  0  1  2]
  [ 0  0  0 ...,  4  1  2]
  [ 0  0  2 ...,  6  0  2]]

<<< Some output truncated >>>

 [[ 0  0  0 ...,  0  0  0]
  [ 0  0  0 ...,  0  0  0]
  [ 0  0  0 ...,  0  0  0]
  ...,
  [ 0  3  3 ...,  0  0  8]
  [ 0  6  0 ...,  5  3 13]
  [ 0  5  1 ...,  9  3  8]]]
>>> # Load the image filtering package from scipy
>>> import scipy.ndimage
>>> # Filter into a new array
>>> temp = scipy.ndimage.gaussian_filter ( data, 2.0 )
>>> # Copy back into Slicer
>>> data[:] = temp[:]
>>> t2.Modified()
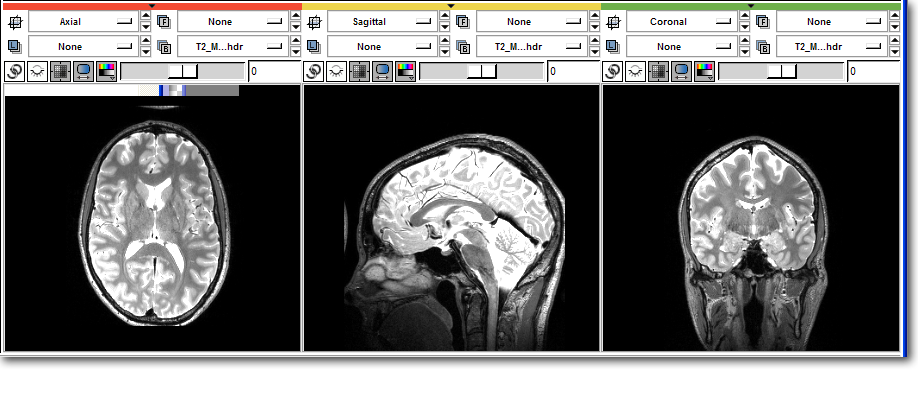
Before:
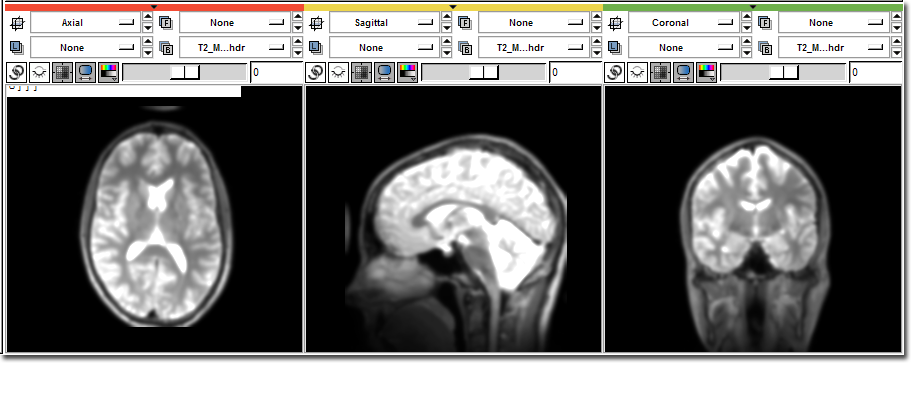
After:
Accessing Tensor Data
Because of the way vtk stores tensors, it is not directly accessible via the GetImageData().ToArray() approach used for scalar images.
Instead, you can access it with something like:
vNodes = Slicer.slicer.ListVolumeNodes()
i = vNodes['dti'].GetImageData().GetPointData().GetTensors().ToArray()
The default shape of this will be Nx9 where N is the total number of voxels in the volume. You can convert these to tensors with something like:
d = vNodes['dti'].GetImageData().GetDimensions()
d.reverse()
tensors = i.reshape(d+[3,3])
Example: compare two tensors Here there are two tensors, one baseline and the other the result of a calculation. The goal is to see the effect of rounding error on the images.
#
# first get the two tensor arrays and create an elementwise difference
#
>>> ref = vn['dt-helix-ref-BS'].GetImageData().GetPointData().GetTensors().ToArray()
>>> calc = vn['dt-helix-transformed3'].GetImageData().GetPointData().GetTensors().ToArray()
>>> diff = calc - ref

#
# find the point indices where the tensors differ, and print the values at those points
#
>>> import numpy
>>> points = numpy.where( diff != 0.0 )
>>> points
(array([28536, 28536]), array([2, 6]))
>>> diff[points]
array([ -2.91038305e-11,  -2.91038305e-11], dtype=float32)
The NumPy command line module
In order to speed up experimentation, a Numpy command line module is available.
It takes in input one or two volume nodes and an output volume node, plus a path to a Python script residing in a text file.
Upon execution, input volume nodes are converted to ndarray variables named iarray and iarray2. The user simply has to put Numpy/Scipy code in the text file, taking care that the output array is stored in a variable named oarray. For example, the file could look like
import scipy.ndimage
oarray = scipy.ndimage.gaussian_filter ( iarray, 2.0 )
The module will take care of taking the content of oarray and storing it in the output volume node (note: differently from the example above, and more in line with Slicer practices, the result of processing is stored in a different output volume, which is selected from the node selector).
To rerun different NumPy code on the input image, simply edit the script file, save it and rerun the module.
Cython support
Cython is an open source project that compiles a Python code into a shared library. Cython can compile most Python code, but gains the most speed when the Python code is augmented with clues to Cython regarding the datatype of a variable. To use Cython on your Slicer Python (slipy?) code, you must compile the Cython code into a shared library. All example code may be found on the slipy project (Tractograhpy was fat-fingered) on Github.
First install Cython:
hg clone http://hg.cython.org/cython-closures/
cd cython-closures
~/Slicer3-lib/Python-build/bin/python setup.py install
Next, create setup.py to build your code:
import distutils
import distutils.sysconfig

from distutils.core import setup
from distutils.extension import Extension
from Cython.Distutils import build_ext

ext_modules = [Extension("OneTensorCython", ["OneTensorCython.pyx"])]

setup(
    name = 'Tractography filtering with python',
    cmdclass = {'build_ext': build_ext},
    ext_modules = ext_modules
)
Build your Cython code with Slicer's Python using the --inplace flag:
~/Slicer3-lib/Python-build/bin/python setup.py build_ext --inplace
To use your Cython code as a Slicer module, you will need to write a pure Python wrapper. The current plug-in mechanism interrogates the function for it's parameters, which does not work on the compiled functions that Cython uses. This example simply passes through to the Cython module OneTensorCython.
import OneTensorCython

XML = OneTensorCython.XML

def Execute(dwi_node, seeds_node, mask_node, ff_node):
    OneTensorCython.Execute (dwi_node, seeds_node, mask_node, ff_node)
Matplotlib plotting functionality
Matplotlib may be used from within Slicer, but the default Tk backend locks up and crashes Slicer. However, Matplotlib may still be used through other backends. More details can be found on the MatPlotLib pages.
Non-interactive plot
try:
  import matplotlib
except ModuleNotFoundError:
  pip_install('matplotlib')
  import matplotlib

matplotlib.use('Agg')
from pylab import *

t1 = arange(0.0, 5.0, 0.1)
t2 = arange(0.0, 5.0, 0.02)
t3 = arange(0.0, 2.0, 0.01)

subplot(211)
plot(t1, cos(2*pi*t1)*exp(-t1), 'bo', t2, cos(2*pi*t2)*exp(-t2), 'k')
grid(True)
title('A tale of 2 subplots')
ylabel('Damped')

subplot(212)
plot(t3, cos(2*pi*t3), 'r--')
grid(True)
xlabel('time (s)')
ylabel('Undamped')
savefig('MatplotlibExample.png')

# Static image view
pm = qt.QPixmap("MatplotlibExample.png")
imageWidget = qt.QLabel()
imageWidget.setPixmap(pm)
imageWidget.setScaledContents(True)
imageWidget.show()
Non-interactive plot in Jupyter notebook
try:
  import matplotlib
except ModuleNotFoundError:
  pip_install('matplotlib')
  import matplotlib

matplotlib.use('Agg')
from pylab import *

t1 = arange(0.0, 5.0, 0.1)
t2 = arange(0.0, 5.0, 0.02)
t3 = arange(0.0, 2.0, 0.01)

subplot(211)
plot(t1, cos(2*pi*t1)*exp(-t1), 'bo', t2, cos(2*pi*t2)*exp(-t2), 'k')
grid(True)
title('A tale of 2 subplots')
ylabel('Damped')

subplot(212)
plot(t3, cos(2*pi*t3), 'r--')
grid(True)
xlabel('time (s)')
ylabel('Undamped')
savefig('MatplotlibExample.png')
display(filename='MatplotlibExample.png', type="image/png", binary=True)
Interactive plot using wxWidgets GUI toolkit
try:
  import matplotlib
  import wxPython
except ModuleNotFoundError:
  pip_install('matplotlib wxPython')
  import matplotlib
  import wxPython

# Get a volume from SampleData and compute its histogram
import SampleData
import numpy as np
volumeNode = SampleData.SampleDataLogic().downloadMRHead()
histogram = np.histogram(arrayFromVolume(volumeNode), bins=50)

# Set matplotlib to use WXAgg backend
import matplotlib
matplotlib.use('WXAgg')

# Show an interactive plot
import matplotlib.pyplot as plt
fig, ax = plt.subplots()
ax.plot(histogram[1][1:], histogram[0].astype(float))
ax.grid(True)
ax.set_ylim((0, 4e5))
plt.show(block=False)
Where to go from here
Far from exhaustive, this documentation is intended to whet the appitite of researchers who love the power of Matlab, but feel trapped inside, unable to break out and deploy applications. This Python interface to Slicer is intended to help! Here are some selected resources to begin to understand the power of what the combined NumPy - Slicer package offers.
Python Language Information
Numpy and Scipy Information
- NumPy documentation
- Comprehensive Guide to NumPy by the current maintainer
- Old NumPy documentation (pdf)
- SciPy Documentation
- MatPlotLib
Writing Slicer Modules in Python
For full GUI module example: see Endoscopy module in Modules/Endoscopy (EndoscopyGUI.py)
- See Slicer3:Python:ScriptedModulesTipsNTricks for some Tips'n'Tricks in connection with writing Python Scripted Modules
Painless Development in Slicer3 with Python, talk given by Demian Wassermann at the LMI, sept. 2008
- Slides: Introduction to Slicer3 with Python: media:PythonSlicer.pdf
- Slides: Numpy indexing and example: media:PythonSlicerNumpy.pdf
- See Demian's Example Code
Slicer Python breakout session in Salt Lake City, Winter Project Week 2009, by Luca Antiga.
Additional Experiments
- An experiment to create an OpenGL VTK Actor in Python.
- An experiment to call ITK with C++ from Python using weave.
- Installing ipython interface
