Difference between revisions of "Documentation/Nightly/Extensions/ShapeRegressionExtension"
(Created page with "<noinclude>{{documentation/versioncheck}}</noinclude> <!-- ---------------------------- --> {{documentation/{{documentation/version}}/module-header}} <!-- --------------------...") |
|||
| Line 29: | Line 29: | ||
* RegressionVisualization: | * RegressionVisualization: | ||
** Plotting of the time-regressed shape volume evolution according to a linear variable | ** Plotting of the time-regressed shape volume evolution according to a linear variable | ||
| − | ** Visualization of the sequence of the time-regressed shapes generated (using [ | + | ** Visualization of the sequence of the time-regressed shapes generated (using [[Documentation/{{documentation/version}}/Extensions/Sequences|Sequences]] module) |
<!-- ---------------------------- --> | <!-- ---------------------------- --> | ||
| Line 98: | Line 98: | ||
==Regression Visualization Module== | ==Regression Visualization Module== | ||
| − | This module allows to easily visualize the results obtained by the RegressionComputation module by using severals slicer extensions ([ | + | This module allows to easily visualize the results obtained by the RegressionComputation module by using severals slicer extensions ([[Documentation/{{documentation/version}}/Extensions/Sequences|Sequences]], [[Documentation/{{documentation/version}}/Modules/Colors|Colors]], [[Documentation/{{documentation/version}}/Modules/Tables|Tables]]). |
Revision as of 23:21, 30 January 2018
Home < Documentation < Nightly < Extensions < ShapeRegressionExtension
|
For the latest Slicer documentation, visit the read-the-docs. |
Introduction and Acknowledgements
|
Extensions: ShapeRegressionExtension |
Extension Description
This extension is composed by two modules :
- RegressionComputation:
- Computation of time-regressed shapes in a collection of 3D shape inputs associated to a linear variable thanks to shape4D CLI.
- RegressionVisualization:
- Plotting of the time-regressed shape volume evolution according to a linear variable
- Visualization of the sequence of the time-regressed shapes generated (using Sequences module)
Interface
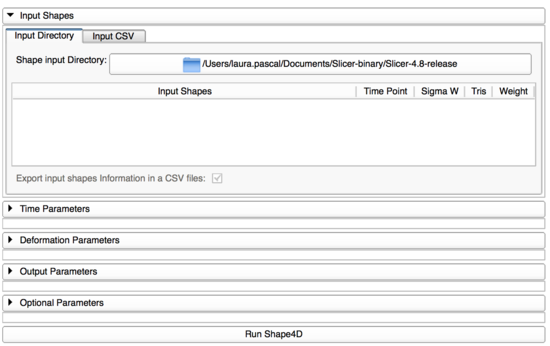
Regression Computation module:
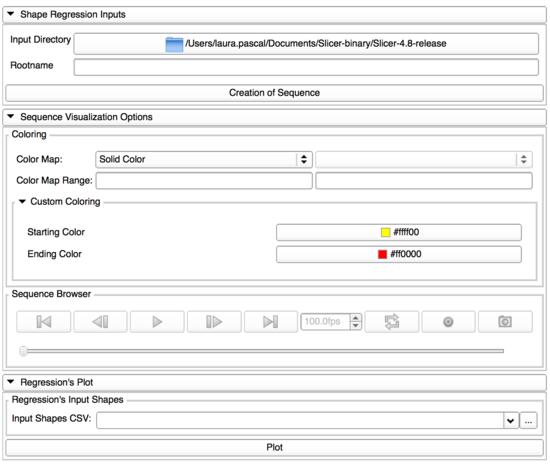
Regression Visualization module:
Use Cases
Regression Computation Module
This module is a user-friendly interface allowing to easily use shape4D CLI in order to compute time-regressed shapes in a collection of 3D shape inputs associated to a linear variable.
Shape4D Inputs
| This section allows the user to specify the input shapes for each time point as well as their associated parameters.
To do so, the user can either specify :
|
Shape4D Parameters
Time Parameters
This section allows the user to specify:
|
Output Parameters
Shape4D CLI will compute several sets of time-regressed shapes where the basename of each shape will be: <prefix>_n_time_00i with:- <prefix>: the prefix can be specified by the user
- n: the iteration number of the shape regression process (i.e. represents the number of the time-regressed shape serie)
- i: the time-regressed shape number
This section allows the user to specify :
|
Optimal Parameters
This section allows the user to specify:
|
Regression Visualization Module
This module allows to easily visualize the results obtained by the RegressionComputation module by using severals slicer extensions (Sequences, Colors, Tables).
Inputs
This section allows the user to create a sequence containing the time-regressed shapes computed by RegressionComputation module.In order to do that, the user would have to specify:
|
Visualization
Sequence Visualization
In this tab, the user could:
|
Regression Plot
This tab allows the user to plot the time-regressed shape volume evolution according to the time.To do so, the user will have to specify the path of a CSV file containing the following information used to compute the set of time-regressed shapes in RegressionComputation module:
|
Additional Information
This extension is available on 3DSlicer and on SlicerSALT.
Similar Modules
N/A
Information for Developers
The source code is available on github


