Difference between revisions of "Documentation/Nightly/Modules/DWModeling"
| Line 83: | Line 83: | ||
[4] Bennett KM, Schmainda KM, Bennett RT, Rowe DB, Lu H, Hyde JS. Characterization of continuously distributed cortical water diffusion rates with a stretched-exponential model. Magn Reson Med. 2003;50: 727–734. doi:10.1002/mrm.10581 | [4] Bennett KM, Schmainda KM, Bennett RT, Rowe DB, Lu H, Hyde JS. Characterization of continuously distributed cortical water diffusion rates with a stretched-exponential model. Magn Reson Med. 2003;50: 727–734. doi:10.1002/mrm.10581 | ||
| + | |||
| + | [5] The Minitab Blog: Regression Analysis: How Do I Interpret R-squared and Assess the Goodness-of-Fit? http://blog.minitab.com/blog/adventures-in-statistics/regression-analysis-how-do-i-interpret-r-squared-and-assess-the-goodness-of-fit | ||
<!-- ---------------------------- --> | <!-- ---------------------------- --> | ||
Latest revision as of 12:30, 21 March 2016
Home < Documentation < Nightly < Modules < DWModeling
|
For the latest Slicer documentation, visit the read-the-docs. |
Introduction and Acknowledgements
|
Module Description
The purpose of this module is to provide estimation of DWI quantitative parameters using commonly diffusion models. Input data should be a trace DWI image correctly identified as a multivolume by b-value by the Slicer DICOMBrowser. The module currently supports mono-exponential, bi-exponential, kurtosis, stretched exponential and gamma distribution DW models, see references for further details on the models.
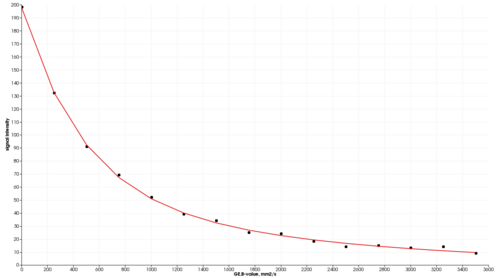
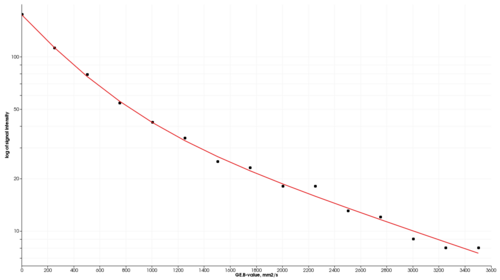
Modeling results can be explored (interactive curve plotting of the input and fitted data) using MultiVolumeExplorer module.
Development of this module was motivated by the application in DWI of prostate cancer. Testing was done on the DWI MRI data collected on a 3T GE Discovery 750w platform (trace images from DWI obtained with 3 orthogonal diffusion directions) at Brigham and Women's hospital. The module was used to obtain results presented in [2].
Use Cases
- tissue characterization from DWI MRI
- quantitative image analysis
- treatment response assessment
Tutorials
None at this time ... stay tuned!
Panels and their use
Parameters:
- Input: Input parameters
- Input image (imageName): Input DWI MRI trace multivolume image
- Model (modelName): Select the mathematical model used to fit the data
- Input mask (maskName): Input mask. Optional; if not specified, fitting will be done at all voxels.
- B-values to include (bValuesToInclude): List of integers corresponding to the b-values that should be included in fitting data. Note that only one of the two lists (inlusion or exclusion) should be populated, or both can be empty, in which case all b-values will be used. Optional; if not defined, all b-values will be used.
- B-values to exclude (bValuesToExclude): List of integers corresponding to the b-values that should be excluded from fitting data. Note that only one of the two lists (inlusion or exclusion) should be populated, or both can be empty, in which case all b-values will be used. Optional; if not defined, all b-values will be used.
- Output common to all models:
- Fitted volume (fittedVolumeFileName): Output volume containing the values of the fitted function
- R^2 quality of fit volume (rsqrVolumeFileName): Output volume containing the R^2 measure of the quality of fit. This measure is calculated only for the b-values used in the fitting process.
- SSD for the fitted b-values (ssdFittedVolumeFileName): Volume with the pixel-wise sum of squared differences (SSD) map that takes into consideration only those b-values that were used in the fitting process
- SSD for all b-values (ssdVolumeFileName): Volume with the pixel-wise sum of squared differences (SSD) map that takes into consideration all b-values. Note that this map will be identical to the previous one if the fitting procedure utilized all b-values
- Chi squared for the fitted b-values (csFittedVolumeFileName): Volume with the pixel-wise chi squared map that takes into consideration only those b-values that were used in the fitting process
- Chi squared for all b-values (csVolumeFileName): Volume with the pixel-wise pixel-wise chi squared map that takes into consideration all b-values. Note that this map will be identical to the previous one if the fitting procedure utilized all b-values
- MonoExponential model output:
- MonoExp diffusion map (adcMapFileName): Diffusion coefficient map of the mono-exponential model
- BiExponential model outputs:
- Slow diffusion map (slowDiffMapFileName): Slow diffusion coefficient map of the bi-exponential model
- Fast diffusion map (fastDiffMapFileName): Fast diffusion coefficient map of the bi-exponential model
- Fast diffusion fraction map (fastDiffFractionMapFileName): Fast diffusion fraction map of the bi-exponential model
- Kurtosis model outputs:
- Kurtosis diffusion map (kurtosisDiffMapFileName): Diffusion coefficient map of the kurtosis model
- Kurtosis map (kurtosisMapFileName): Kurtosos map
- Gamma distribution model outputs: See Oshio et al. 2014
- Theta parameter map (thetaMapFileName): Theta parameter of the gamma distribution model
- k map (kMapFileName): k map of the gamma distribution model
- Mode map (modeMapFileName): Mode map of the gamma distribution model ( (k-1)*theta )
- Stretched exponential model outputs: See Bennett et al. 2003
- DDC map (DDCMapFileName): Distributed Diffusion Coefficient map
- Stretching parameter map (alphaMapFileName): Stretching parameter (alpha) map
- Initialization: Model-specific initial parameters
- Mono-exponential model (monoExpInitParameters): List of initial model parameters in the following format (all numbers are floating point):initialScale,initialADC
- Bi-exponential model (biExpInitParameters): List of initial model parameters in the following format (all numbers are floating point):initialScale,initialFastDiffusionFraction,initialSlowDiffusionCoefficient,initialFastDiffusionCoefficient
- Kurtosis model (kurtosisInitParameters): List of initial model parameters in the following format (all numbers are floating point):initialScale,initialKurtosis,initialKurtosisDiffusion
- Stretched exponential model parameters (stretchedExpInitParameters): List of initial model parameters in the following format (all numbers are floating point):initialScale,initialDDC,initialAlpha
- Gamma distribution model (gammaInitParameters): List of initial model parameters in the following format (all numbers are floating point):initialScale,initialK,initialTheta
List of parameters generated transforming this XML file using this XSL file. To update the URL of the XML file, edit this page.
Related Modules
References
[1] Toivonen J, Merisaari H, Pesola M, Taimen P, Boström PJ, Pahikkala T, et al. Mathematical models for diffusion-weighted imaging of prostate cancer using b values up to 2000 s/mm2: Correlation with Gleason score and repeatability of region of interest analysis. Magn Reson Med. 2014; http://onlinelibrary.wiley.com/doi/10.1002/mrm.25482/abstract
[2] Kobus T., Fedorov A., Tempany C.M., Mulkern R.V., Dunne R., Maier S.E. Bi-exponential Diffusion Analysis in Normal Prostate and Prostate Cancer: Transition Zone and Peripheral Zone Considerations. Proc. of ISMRM 2015. http://www.spl.harvard.edu/abstracts/item/view/168
[3] Oshio K, Shinmoto H, Mulkern RV. Interpretation of diffusion MR imaging data using a gamma distribution model. Magn Reson Med Sci. 2014;13: 191–195. doi:10.2463/mrms.2014-0016
[4] Bennett KM, Schmainda KM, Bennett RT, Rowe DB, Lu H, Hyde JS. Characterization of continuously distributed cortical water diffusion rates with a stretched-exponential model. Magn Reson Med. 2003;50: 727–734. doi:10.1002/mrm.10581
[5] The Minitab Blog: Regression Analysis: How Do I Interpret R-squared and Assess the Goodness-of-Fit? http://blog.minitab.com/blog/adventures-in-statistics/regression-analysis-how-do-i-interpret-r-squared-and-assess-the-goodness-of-fit


