Difference between revisions of "Documentation/Nightly/Extensions/OpenCAD"
| Line 24: | Line 24: | ||
<!-- ---------------------------- --> | <!-- ---------------------------- --> | ||
{{documentation/{{documentation/version}}/module-section|Module Description}} | {{documentation/{{documentation/version}}/module-section|Module Description}} | ||
| − | The {{documentation/modulename}} is designed to segment tumors from DCE-MRI datasets which include 1 pre-contrast image and 2-4 post-contrast images at different time points. {{documentation/modulename}} uses blackbox methods to calculate the wash-in and wash-out slopes of the contrast dye based on voxel intensity values. The segmentation output is a Label Map with red, yellow, and blue colors respectively identifying washout, plateau, and persistent voxels. | + | The {{documentation/modulename}} is designed to segment tumors from DCE-MRI datasets which include 1 pre-contrast image and 2-4 post-contrast images at different time points. {{documentation/modulename}} uses blackbox methods to calculate the wash-in and wash-out slopes of the contrast dye based on voxel intensity values. The segmentation output is a Label Map with red, yellow, and blue colors respectively identifying washout, plateau, and persistent voxels: |
| + | *Red for Washout curve | ||
| + | **Slope of delayed curve < -0.2 | Type III | ||
| + | *Yellow for Plateau curve | ||
| + | **-0.2 < Slope of delayed curve < 0.2 | Type II | ||
| + | *Blue for Persistent curve | ||
| + | **Slope of delayed curve > 0.2 | Type I | ||
| − | + | <!-- ---------------------------- --> | |
| − | <!-- | ||
| − | |||
| − | |||
| − | |||
| − | |||
| − | |||
| − | |||
| − | |||
| − | |||
| − | |||
{{documentation/{{documentation/version}}/module-section|Features}} | {{documentation/{{documentation/version}}/module-section|Features}} | ||
*Interactive Charting - | *Interactive Charting - | ||
Revision as of 19:20, 25 April 2014
Home < Documentation < Nightly < Extensions < OpenCAD
|
For the latest Slicer documentation, visit the read-the-docs. |
Introduction and Acknowledgements
|
This work is supported by NA-MIC, NCIGT, and the Slicer Community. | |||||||
This project is supported by... |
Module Description
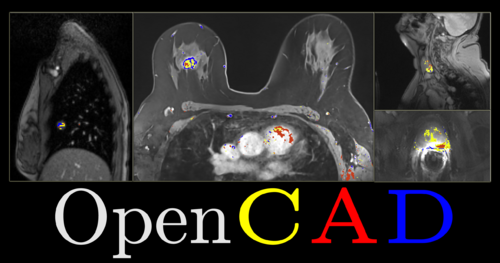
The OpenCAD is designed to segment tumors from DCE-MRI datasets which include 1 pre-contrast image and 2-4 post-contrast images at different time points. OpenCAD uses blackbox methods to calculate the wash-in and wash-out slopes of the contrast dye based on voxel intensity values. The segmentation output is a Label Map with red, yellow, and blue colors respectively identifying washout, plateau, and persistent voxels:
- Red for Washout curve
- Slope of delayed curve < -0.2 | Type III
- Yellow for Plateau curve
- -0.2 < Slope of delayed curve < 0.2 | Type II
- Blue for Persistent curve
- Slope of delayed curve > 0.2 | Type I
Features
- Interactive Charting -
- Volume Rendering -
- Label Statistics -
Tutorials
Data sets
Breast DCE-MRI Data Set 1 (zip file containing the nrrd volumes for the OpenCAD tutorial)
Breast DCE-MRI Data Set 2 (zip file containing additional test set of nrrd volumes)
Liver DCE-MRI Data Set 1 (zip file containing additional test set of nrrd volumes)
Panels and their use
|
The GUI of the OpenCAD module contains 5 sections:
|
Similar Modules
N/A
References
N/A
Information for Developers
| Section under construction. |
Source code: https://github.com/vnarayan13/Slicer-OpenCAD


