Difference between revisions of "Documentation/Nightly/Modules/PkModeling"
From Slicer Wiki
(Prepend documentation/versioncheck template. See http://na-mic.org/Mantis/view.php?id=2887) |
|||
| Line 57: | Line 57: | ||
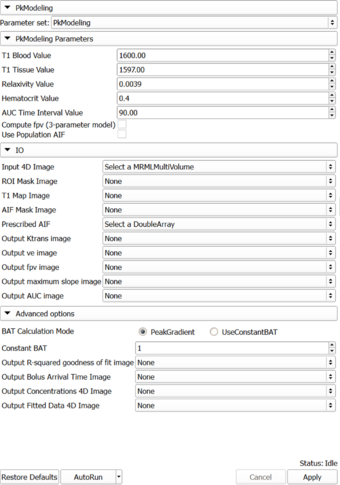
*** T1 Blood Value | *** T1 Blood Value | ||
*** T1 Tissue Value (default value is the published value for prostate tissue estimated in healthy individuals (see Ref. de Bazelaire et al.) | *** T1 Tissue Value (default value is the published value for prostate tissue estimated in healthy individuals (see Ref. de Bazelaire et al.) | ||
| − | *** Relaxivity Value (contrast agent specific | + | *** r1 Relaxivity Value of the contrast agent, L x mol^(-1) x s^(-1). This value is contrast agent specific. Default setting of 0.0039 corresponds to Gd-DPTA (Magnevist) at 3T, see Ref. Pintaske et al. You will need to adjust this setting based on the magnet signal strength and contrast agent. |
*** Hematocrit Value. Volume percentage of red blood cells in blood. | *** Hematocrit Value. Volume percentage of red blood cells in blood. | ||
*** AUC Time Interval Value: Time interval for AUC calculation | *** AUC Time Interval Value: Time interval for AUC calculation | ||
| Line 78: | Line 78: | ||
* [2] Rijpkema M, Kaanders JHAM, Joosten FBM et al: Method for quantitative mapping of dynamic MRI contrast agent uptake in human tumors. J Magn Reson Imaging 2001; 14:457-463. | * [2] Rijpkema M, Kaanders JHAM, Joosten FBM et al: Method for quantitative mapping of dynamic MRI contrast agent uptake in human tumors. J Magn Reson Imaging 2001; 14:457-463. | ||
* [3] de Bazelaire, C.M., et al., MR imaging relaxation times of abdominal and pelvic tissues measured in vivo at 3.0 T: preliminary results. Radiology, 2004. 230(3): p. 652-9. | * [3] de Bazelaire, C.M., et al., MR imaging relaxation times of abdominal and pelvic tissues measured in vivo at 3.0 T: preliminary results. Radiology, 2004. 230(3): p. 652-9. | ||
| − | + | * [4] Pintaske J, Martirosian P, Graf H, Erb G, Lodemann K-P, Claussen CD, Schick F. Relaxivity of Gadopentetate Dimeglumine (Magnevist), Gadobutrol (Gadovist), and Gadobenate Dimeglumine (MultiHance) in human blood plasma at 0.2, 1.5, and 3 Tesla. Investigative radiology. 2006 March;41(3):213–21. | |
<!-- ---------------------------- --> | <!-- ---------------------------- --> | ||
{{documentation/{{documentation/version}}/module-section|Information for Developers}} | {{documentation/{{documentation/version}}/module-section|Information for Developers}} | ||
Revision as of 22:54, 12 July 2013
Home < Documentation < Nightly < Modules < PkModeling
|
For the latest Slicer documentation, visit the read-the-docs. |
Introduction and Acknowledgements
|
Extension: PkModeling | |||||
|
Module Description
|
PkModeling (Pharmacokinetics Modeling) calculates quantitative parameters from Dynamic Contrast Enhanced DCE-MRI images. This module performs two operations:
|
Use Cases
Tutorials
Panels and their use
|
Similar Modules
References
- [1] Knopp MV, Giesel FL, Marcos H et al: Dynamic contrast-enhanced magnetic resonance imaging in oncology. Top Magn Reson Imaging, 2001; 12:301-308.
- [2] Rijpkema M, Kaanders JHAM, Joosten FBM et al: Method for quantitative mapping of dynamic MRI contrast agent uptake in human tumors. J Magn Reson Imaging 2001; 14:457-463.
- [3] de Bazelaire, C.M., et al., MR imaging relaxation times of abdominal and pelvic tissues measured in vivo at 3.0 T: preliminary results. Radiology, 2004. 230(3): p. 652-9.
- [4] Pintaske J, Martirosian P, Graf H, Erb G, Lodemann K-P, Claussen CD, Schick F. Relaxivity of Gadopentetate Dimeglumine (Magnevist), Gadobutrol (Gadovist), and Gadobenate Dimeglumine (MultiHance) in human blood plasma at 0.2, 1.5, and 3 Tesla. Investigative radiology. 2006 March;41(3):213–21.
Information for Developers
| Section under construction. |


