Difference between revisions of "Documentation/4.1/Developers/Python scripting"
| Line 155: | Line 155: | ||
=== Package/Saving Scenes === | === Package/Saving Scenes === | ||
| − | + | >>> import os | |
| + | >>> tempDir = os.path.join(slicer.app.slicerHome, ‘testScene’) | ||
| + | >>> os.mkdir(tempDir) | ||
| + | >>> l = slicer.app.applicationLogic() | ||
| + | >>> l.SaveSceneToSlicerDataBundleDirectory(tempDir, None) | ||
=== Loading DICOM Sets === | === Loading DICOM Sets === | ||
Revision as of 16:35, 11 June 2012
Home < Documentation < 4.1 < Developers < Python scriptingContents
Background
This is an evolution of the python implementation in slicer3. Slicer's APIs are now natively wrapped in python.
Topics like plotting are still experimental in slicer4.
See this 2012 presentation on the state of python in slicer4.
See the python slicer4 tutorial for more examples.
Usage options
Python Interactor
Use the Window->Python Interactor (Control-P on window/linux, Command-P on mac) to bring up the Qt-based console with access to the vtk, Qt, and Slicer wrapped APIs.
Most python code can be installed and run from this window, but because it exists in the event driven Qt GUI environment, some operations like, like parallel processing or headless operation, are not easily supported.
Examples
Start slicer4 and bring up python console. Load a volume like this:
>>> slicer.util.loadVolume(slicer.app.slicerHome + "/share/MRML/Testing/TestData/fixed.nrrd")
Get the volume node for that volume:
>>> n = getNode('fixed')
You can use Tab to see lists of methods for a class instance.
Running a CLI from Python
Here's an example to create a model from a volume using the Grayscale Model Maker
def grayModel(volumeNode):
  parameters = {}
  parameters["InputVolume"] = volumeNode.GetID()
  outModel = slicer.vtkMRMLModelNode()
  slicer.mrmlScene.AddNode( outModel )
  parameters["OutputGeometry"] = outModel.GetID()
  grayMaker = slicer.modules.grayscalemodelmaker
  slicer.cli.run(grayMaker, None, parameters)
To try this, download the MRHead dataset from the Sample Data and paste the code into the python console and then run this:
v = getNode('MRHead')
grayModel(v)
TODO: some more samples of the Qt console
In iPython
Important: The example below was developed for an early beta version of slicer4 and is not supported in Slicer 4.0 or 4.1
See this thread for information on adapting this approach to Slicer 4.1.
iPython is a powerful shell and can also be used to access the vtk and slicer APIs (but not Qt at the moment).
As of Slicer4 beta in February 2011, it is possible to use these steps for installation. This has only been tested on a ubuntu linux system so far.
These instructions assume you have a Slicer4-superbuild directory created according to the Slicer4 Build Instructions.
See the [1] website for more example plot types.
Prerequisites
- Get readline - it will make iPython more useful.
# do this before building slicer4 - or do "cd Slicer4-superbuild/; rm -rf python* ; make"
sudo apt-get install libreadline6-dev
cd to your Slicer4-superbuild directory for the rest of these steps
- Install the vtk package in the python tree
# TODO: this should be done in superbuild script
(cd ./VTK-build/Wrapping/Python;  ../../../Slicer-build/Slicer4 --launch ../../../python-build/bin/python setup.py install)
- Install ipython:
git clone git://github.com/ipython/ipython.git
(cd ./ipython; git checkout 0.10.2)
(cd ./ipython;  ../Slicer-build/Slicer4 --launch ../python-build/bin/python setup.py install)
- Install matplotlib (remove the source after installing so python import will not get confused by it.)
git clone git://github.com/pieper/matplotlib.git
(cd ./matplotlib;  ../Slicer-build/Slicer4 --launch ../python-build/bin/python setup.py install)
rm -rf matplotlib
Now try it!
Launch an xterm with all the paths set correctly to find the slicer python packages
./Slicer-build/Slicer4 --launch xterm &
Now, inside the xterm launch ipython
./python-build/bin/ipython
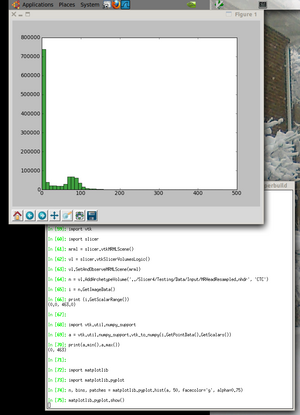
Inside ipython you can past the following script that does:
- create a mrml scene and add a volume
- make a numpy aray from the image data
- do calculations in numpy and vtk for comparision
- make a histogram plot of the data
import vtk
import slicer
mrml = slicer.vtkMRMLScene()
vl = slicer.vtkSlicerVolumesLogic()
vl.SetAndObserveMRMLScene(mrml)
n = vl.AddArchetypeVolume('../Slicer4/Testing/Data/Input/MRHeadResampled.nhdr', 'CTC')
i = n.GetImageData()
print (i.GetScalarRange())

import vtk.util.numpy_support
a = vtk.util.numpy_support.vtk_to_numpy(i.GetPointData().GetScalars())
print(a.min(),a.max())

import matplotlib
import matplotlib.pyplot
n, bins, patches = matplotlib.pyplot.hist(a, 50, facecolor='g', alpha=0.75)
matplotlib.pyplot.show()
If all goes well, you should see an image like the one shown here.
Parallel Processing
In the shell, run this to install joblib
wget http://pypi.python.org/packages/source/j/joblib/joblib-0.4.6.dev.tar.gz
tar xvfz joblib-0.4.6.dev.tar.gz
(cd ./joblib-0.4.6.dev;  ../Slicer-build/Slicer4 --launch ../python-build/bin/python setup.py install)
Then in ipython you can run this example:
from joblib import *
from math import *
for jobs in xrange(1,8):
  print (jobs, Parallel(n_jobs=jobs)(delayed(sqrt)(i**2) for i in range(10000))[-1])
Package/Saving Scenes
>>> import os >>> tempDir = os.path.join(slicer.app.slicerHome, ‘testScene’) >>> os.mkdir(tempDir) >>> l = slicer.app.applicationLogic() >>> l.SaveSceneToSlicerDataBundleDirectory(tempDir, None)
Loading DICOM Sets
Text here - SunilK.
Issues
- matplotlib currently uses Tk to show the window on Linux and it does not handle pan/zoom events correctly. Ideally there would be a PythonQt wrapper for the plots and this is probably required for use on windows (and maybe mac).
- the matplotlib window is in the same thread with the ipython window so you cannot keep the plot open while working on the next one. However you can save the plot to a file (png, pdf, etc...) and look at it with another program while working in ipython.
- in slicer4 the PythonQt package is loaded as 'qt', however matplotlib tries running 'import qt' as a way to determine if it is running in PyQt version 3. Because of this a patched version of matplotlib is required (see this diff)
- Tested in Windows 7: Python 2.6.6 (used in Slicer 4.1) has errors in referencing its XML DOM parsers, such as ElementTree. This is a Windows-specific issue -- the same code works in Linux Ubuntu. Solution thus far is to write your own XML parser.
