Difference between revisions of "Documentation/4.1/Modules/BRAINSMush"
StevenDunn (talk | contribs) |
StevenDunn (talk | contribs) |
||
| Line 12: | Line 12: | ||
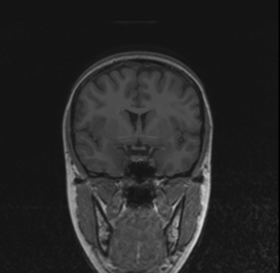
|[[Image:T2.png|thumb|280px|T2 Image]] | |[[Image:T2.png|thumb|280px|T2 Image]] | ||
|} | |} | ||
| + | |||
{| | {| | ||
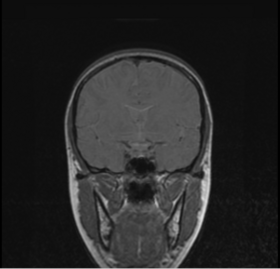
|[[Image:Mush.png|thumb|280px|Mush Image]] | |[[Image:Mush.png|thumb|280px|Mush Image]] | ||
| + | |[[Image:Mask.png|thumb|280px|Mush Brain Extraction Mask]] | ||
|} | |} | ||
Revision as of 03:57, 4 May 2010
Home < Documentation < 4.1 < Modules < BRAINSMushReturn to Slicer 3.6 Documentation
BRAINSMush
BRAINSMush
General Information
Module Type & Category
Type: CLI
Category: Segmentation
Authors, Collaborators & Contact
- Ronald Pierson, University of Iowa
- Gregory Harris, University of Iowa
- Hans Johnson, PhD: University of Iowa
- Steven A. Dunn: University of Iowa
- Vincent Magnotta, PhD: University of Iowa
- Contacts: Vincent Magnotta, vincent-magnotta@uiowa.edu; Steven Dunn, steven-dunn@uiowa.edu
Module Description
BRAINSMush uses the Maximize Uniformity Summation Heuristic(MUSH) optimizer, as developed at the University of Iowa, to extract the brain and surface CSF from a multi-modal imaging study. It forms a linear combination of multi-modal MR imaging data to make the signal intensity within the brain as uniform as possible. This resulting image is then thresholded to obtain the brain and surface CSF region.
MUSH uses a T1-weighted and T2-weighted image as its inputs, and their mean and variance are calculated. A linear combination is then found that approaches the desired mean and variance( by default 1000.0 and 0.0, respectively) by only varying the coefficients a and b in the following equation:
Within the region of interest, the MUSH optimizer finds the number of voxels, the sum voxels and the sum of squares for
both images separately. Then a 2 by 2 Levenberg-Marquardt optimizer repeatedly reconstructs the mean and variance of
the mixture model corresponding to the weighted sum image of coefficients a and b. This is very fast because each step
only involves the calculation of two jointly weighted statistics. The result of optimization is the pair of linear coefficients
that minimizes the sum of squares error:
The image is thresholded by the mean signal intensity plus-or-minus five standard deviations.
This method was applied to a sample of 20 MR brain scans and its results were compared to those obtained by 3dSkullStrip, 3dIntracranial, BET and BET2. The average Jaccard metrics for the twenty subjects was 0.66(BET), 0.61(BET2), 0.88(3dIntracranial), 0.91(3dSkullStrip) and 0.94(MUSH).
Usage
Use Cases, Examples
The processing involved in the module is not designed for interactive use. It may take up to 15 minutes( or longer, depending on processor speed) to process a dataset.
This module is especially appropriate for these use cases:
- Use Case 1:
- Use Case 2:
Examples of the module in use:
- Example 1
- Example 2
Tutorials
Links to tutorials explaining how to use this module:
- Tutorial 1
- Data Set 1
Quick Tour of Features and Use
A list panels in the interface, their features, what they mean, and how to use them. For instance:
|
Development
Notes from the Developer(s)
Algorithms used, library classes depended upon, use cases, etc.
Dependencies
Other modules or packages that are required for this module's use.
Tests
On the Dashboard, these tests verify that the module is working on various platforms:
- MyModuleTest1 MyModuleTest1.cxx
- MyModuleTest2 MyModuleTest2.cxx
Known bugs
Links to known bugs in the Slicer3 bug tracker
Usability issues
Follow this link to the Slicer3 bug tracker. Please select the usability issue category when browsing or contributing.
Source code & documentation
Links to the module's source code:
Source code:
Doxygen documentation:
More Information
Acknowledgment
Include funding and other support here.
References
Publications related to this module go here. Links to pdfs would be useful.


