Difference between revisions of "Documentation/Nightly/Modules/HeterogeneityCAD"
| (18 intermediate revisions by 2 users not shown) | |||
| Line 3: | Line 3: | ||
{{documentation/{{documentation/version}}/module-header}} | {{documentation/{{documentation/version}}/module-header}} | ||
<!-- ---------------------------- --> | <!-- ---------------------------- --> | ||
| − | [[Image: | + | [[Image:HeterogeneityCAD.PNG|thumb|center|500px|]] |
<!-- ---------------------------- --> | <!-- ---------------------------- --> | ||
{{documentation/{{documentation/version}}/module-section|Introduction and Acknowledgements}} | {{documentation/{{documentation/version}}/module-section|Introduction and Acknowledgements}} | ||
| Line 25: | Line 25: | ||
<!-- ---------------------------- --> | <!-- ---------------------------- --> | ||
{{documentation/{{documentation/version}}/module-section|Module Description}} | {{documentation/{{documentation/version}}/module-section|Module Description}} | ||
| − | The {{documentation/modulename}} module is an image feature extraction toolbox primarily to quantify the heterogeneity of tumor images and their label maps. | + | The {{documentation/modulename}} module is an image feature extraction toolbox primarily to quantify the heterogeneity of tumor images and their label maps. Source code for batch processing without the GUI is also included at the end of this document. |
<!-- ---------------------------- --> | <!-- ---------------------------- --> | ||
{{documentation/{{documentation/version}}/module-section|Navigating the Module}} | {{documentation/{{documentation/version}}/module-section|Navigating the Module}} | ||
| − | |||
| − | |||
| − | |||
| − | |||
| − | |||
| − | |||
{| | {| | ||
| Line 55: | Line 49: | ||
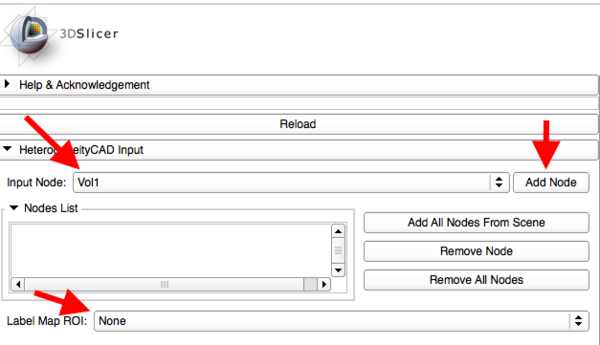
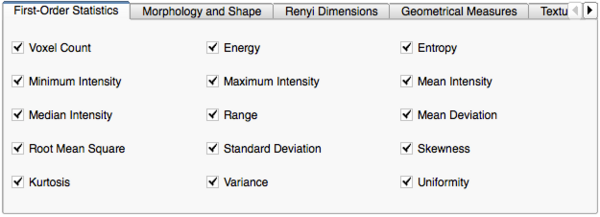
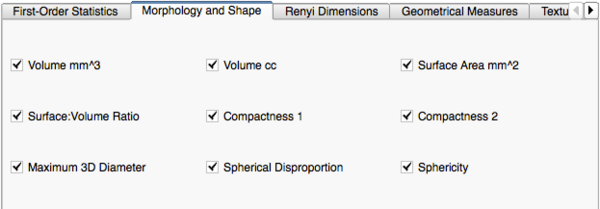
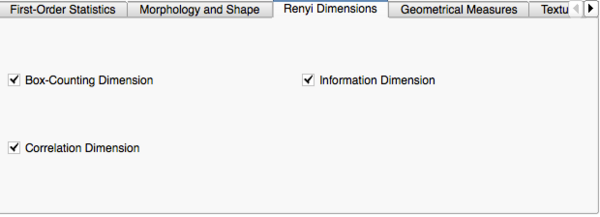
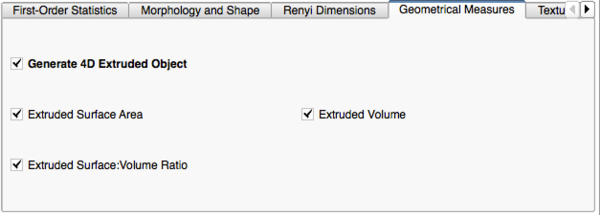
**An individual metric can be included or excluded from the computation by checking or unchecking its checkbox | **An individual metric can be included or excluded from the computation by checking or unchecking its checkbox | ||
**For some feature classes, unchecking the critical computations (in bold) will disable the other metrics | **For some feature classes, unchecking the critical computations (in bold) will disable the other metrics | ||
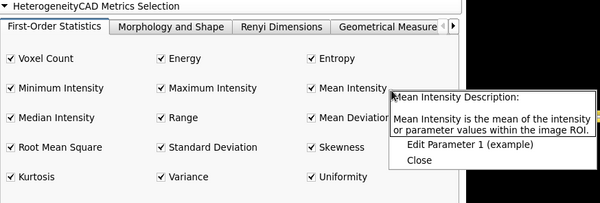
| − | ** | + | **'''Right-Clicking on a metric''' will open a description and a menu for editing metric parameters |
| − | + | ***i.e. in the adjacent Figure right-clicking on the 'Mean Intensity' metric displays a description and a parameter menu | |
| − | ***i.e. in Figure | ||
|[[Image:Metric-help.png|thumb|600px|Metric Panel]] | |[[Image:Metric-help.png|thumb|600px|Metric Panel]] | ||
|} | |} | ||
| − | |||
{| | {| | ||
| | | | ||
| − | + | *'''HeterogeneityCAD Metrics Output and Summary''' | |
| − | |||
| − | |||
| − | |||
| − | |||
| − | |||
| − | |||
| − | |||
| − | |||
| − | *'''HeterogeneityCAD Metrics | ||
| − | |||
| − | |||
| − | |||
| − | |||
| − | |||
| − | |||
| − | |||
**Clicking 'Apply HeterogeneityCAD' begins computation of the selected metrics for every Node in the Nodes List | **Clicking 'Apply HeterogeneityCAD' begins computation of the selected metrics for every Node in the Nodes List | ||
**A Progress Bar will show the Node and which feature class of metrics is currently being computed | **A Progress Bar will show the Node and which feature class of metrics is currently being computed | ||
| Line 87: | Line 63: | ||
***i.e. in Figure 3, each row will represent a Node, and each column will display the output of each selected metric | ***i.e. in Figure 3, each row will represent a Node, and each column will display the output of each selected metric | ||
**Clicking 'Save to File' will prompt the user to save the table information as a Comma-Separated value (CSV) File | **Clicking 'Save to File' will prompt the user to save the table information as a Comma-Separated value (CSV) File | ||
| − | + | |[[Image:ApplyCAD.png|thumb|600px|Apply HeterogeneityCAD]] | |
| − | + | [[Image:MetricSummary.png|thumb|600px|Metric Summary]] | |
| − | |||
|} | |} | ||
| − | |||
| − | |||
<!-- ---------------------------- --> | <!-- ---------------------------- --> | ||
{{documentation/{{documentation/version}}/module-section|Data sets}} | {{documentation/{{documentation/version}}/module-section|Data sets}} | ||
| − | + | {| | |
| + | | | ||
| + | *[[Media:BreastHeteroCADData.zip|Breast DCE-MRI Data Set (zip file containing the nrrd volumes for the tutorial)]] | ||
| + | |[[Image:Data.png|thumb|600px|Sample Data]] | ||
| + | |} | ||
<!-- ---------------------------- --> | <!-- ---------------------------- --> | ||
{{documentation/{{documentation/version}}/module-section|Quick Instructions for Use}} | {{documentation/{{documentation/version}}/module-section|Quick Instructions for Use}} | ||
| Line 168: | Line 145: | ||
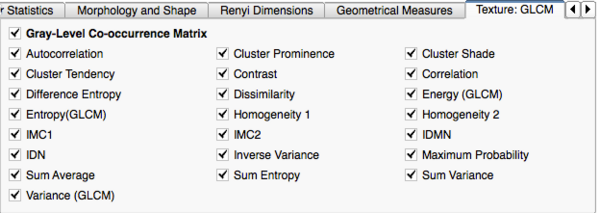
*'''Texture: Gray-Level Co-occurrence Matrix (GLCM)''' | *'''Texture: Gray-Level Co-occurrence Matrix (GLCM)''' | ||
**'''Autocorrelation: '''A measure of the magnitude of the fineness and coarseness of texture. | **'''Autocorrelation: '''A measure of the magnitude of the fineness and coarseness of texture. | ||
| − | |||
| − | |||
| − | |||
**'''Cluster Prominence: '''A measure of the skewness and asymmetry of the GLCM. A higher values implies more asymmetry about the mean value while a lower value indicates a peak around the mean value and less variation about the mean. | **'''Cluster Prominence: '''A measure of the skewness and asymmetry of the GLCM. A higher values implies more asymmetry about the mean value while a lower value indicates a peak around the mean value and less variation about the mean. | ||
**'''Cluster Shade: '''A measure of the skewness and uniformity of the GLCM. A higher cluster shade implies greater asymmetry. | **'''Cluster Shade: '''A measure of the skewness and uniformity of the GLCM. A higher cluster shade implies greater asymmetry. | ||
| Line 216: | Line 190: | ||
<!-- ---------------------------- --> | <!-- ---------------------------- --> | ||
{{documentation/{{documentation/version}}/module-section|Similar Modules}} | {{documentation/{{documentation/version}}/module-section|Similar Modules}} | ||
| − | + | Label Statistics | |
<!-- ---------------------------- --> | <!-- ---------------------------- --> | ||
{{documentation/{{documentation/version}}/module-section|References}} | {{documentation/{{documentation/version}}/module-section|References}} | ||
| − | N | + | * J. Jayender, E. Gombos, S. Chikarmane, D. Dabydeen, F. A. Jolesz, and K. G. Vosburgh, “Statistical Learning Algorithm for In-situ and Invasive Breast Carcinoma Segmentation”, Journal of Computerized Medical Imaging and Graphics, vol. 37, no. 4, pp. 281-292, 2013 |
| + | * J. Jayender, S. A. Chikarmane, F. A. Jolesz and E. Gombos, “Automatic Segmentation of Invasive Breast Carcinomas from DCE-MRI using Time Series Analysis”, Journal of MRI, Article first published online 23 September 2013, doi: 10.1002/jmri.24394 | ||
| + | * J. Jayender, K.G. Vosburgh, E. Gombos, A. Ashraf, D. Kontos, S.C. Gavenonis, F. A. Jolesz and K. Pohl , “Automatic Segmentation of Breast Carcinomas from DCE-MRI using a Statistical Learning Algorithm”, IEEE International Symposium on Biomedical Imaging, pp. 122-125, 2012. | ||
| + | * J. Jayender, D.T. Ruan, V. Narayan, N. Agrawal, F. A. Jolesz and H. Mamata, “Segmentation of Parathyroid Tumors from DCE-MRI using Linear Dynamic System Analysis”, IEEE International Symposium on Biomedical Imaging, 2013. | ||
| + | * J. Jayender, J. Jagannathan, S.Chikarmane, C.P.Raut and F.A. Jolesz, “Computer-Aided Diagnosis of Breast Angiosarcoma: Results in 14 cases”, Quantitative Medical Imaging Symposium, 2013 (invited paper). | ||
| + | * HJWL Aerts, ER Velazquez, RTH Leijenaar, et al., "Decoding tumour phenotype by noninvasive imaging using a quantitative radiomics approach", vol. 5, Nat Communication, 2014. | ||
| + | |||
<!-- ---------------------------- --> | <!-- ---------------------------- --> | ||
{{documentation/{{documentation/version}}/module-section|Information for Developers}} | {{documentation/{{documentation/version}}/module-section|Information for Developers}} | ||
| + | To be added so that developers can add their metrics. Also, we are validating the metrics - please use caution while using them. | ||
| + | |||
| + | Download from: https://github.com/vnarayan13/Slicer-OpenCAD | ||
| + | Source code: https://github.com/vnarayan13/Slicer-OpenCAD/tree/master/HeterogeneityCAD | ||
| − | Source code: https://github.com | + | Source code for batch processing: https://github.com/Slicer-OpenCAD/HeterogeneityCADScript |
| + | [Use the TestScript.bash script for batch processing] | ||
<!-- ---------------------------- --> | <!-- ---------------------------- --> | ||
<!-- ---------------------------- --> | <!-- ---------------------------- --> | ||
Latest revision as of 21:57, 22 March 2016
Home < Documentation < Nightly < Modules < HeterogeneityCAD
|
For the latest Slicer documentation, visit the read-the-docs. |
Introduction and Acknowledgements
|
Extension: OpenCAD | |||||||
This project is supported by P41 RR019703/RR/NCRR NIH HHS/United States, P01 CA067165/CA/NCI NIH HHS/United States and P41 EB015898/EB/NIBIB NIH HHS/United States |
Module Description
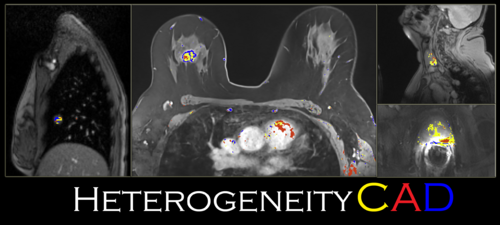
The HeterogeneityCAD module is an image feature extraction toolbox primarily to quantify the heterogeneity of tumor images and their label maps. Source code for batch processing without the GUI is also included at the end of this document.
|
|
|
Data sets
Quick Instructions for Use
- Add an image or parameter map (.nrrd file) to the Nodes List
- Select a corresponding segmentation label map to use as ROI
- Click "Apply HeterogeneityCAD"
Image Features and Metrics
|
|
|
|
|
|
Similar Modules
Label Statistics
References
- J. Jayender, E. Gombos, S. Chikarmane, D. Dabydeen, F. A. Jolesz, and K. G. Vosburgh, “Statistical Learning Algorithm for In-situ and Invasive Breast Carcinoma Segmentation”, Journal of Computerized Medical Imaging and Graphics, vol. 37, no. 4, pp. 281-292, 2013
- J. Jayender, S. A. Chikarmane, F. A. Jolesz and E. Gombos, “Automatic Segmentation of Invasive Breast Carcinomas from DCE-MRI using Time Series Analysis”, Journal of MRI, Article first published online 23 September 2013, doi: 10.1002/jmri.24394
- J. Jayender, K.G. Vosburgh, E. Gombos, A. Ashraf, D. Kontos, S.C. Gavenonis, F. A. Jolesz and K. Pohl , “Automatic Segmentation of Breast Carcinomas from DCE-MRI using a Statistical Learning Algorithm”, IEEE International Symposium on Biomedical Imaging, pp. 122-125, 2012.
- J. Jayender, D.T. Ruan, V. Narayan, N. Agrawal, F. A. Jolesz and H. Mamata, “Segmentation of Parathyroid Tumors from DCE-MRI using Linear Dynamic System Analysis”, IEEE International Symposium on Biomedical Imaging, 2013.
- J. Jayender, J. Jagannathan, S.Chikarmane, C.P.Raut and F.A. Jolesz, “Computer-Aided Diagnosis of Breast Angiosarcoma: Results in 14 cases”, Quantitative Medical Imaging Symposium, 2013 (invited paper).
- HJWL Aerts, ER Velazquez, RTH Leijenaar, et al., "Decoding tumour phenotype by noninvasive imaging using a quantitative radiomics approach", vol. 5, Nat Communication, 2014.
Information for Developers
To be added so that developers can add their metrics. Also, we are validating the metrics - please use caution while using them.
Download from: https://github.com/vnarayan13/Slicer-OpenCAD
Source code: https://github.com/vnarayan13/Slicer-OpenCAD/tree/master/HeterogeneityCAD
Source code for batch processing: https://github.com/Slicer-OpenCAD/HeterogeneityCADScript [Use the TestScript.bash script for batch processing]
