Difference between revisions of "Documentation/4.4/gif tutorial"
From Slicer Wiki
| (18 intermediate revisions by the same user not shown) | |||
| Line 1: | Line 1: | ||
|[[image:Neurosurgical Planning tutorial.png|700px|center]] | |[[image:Neurosurgical Planning tutorial.png|700px|center]] | ||
| − | === | + | ===Loading DTI and Baseline Data=== |
| − | <div style="width: 62%; height: | + | <div style="width: 62%; height:525px; overflow:auto; border: 2px solid #088; margin: 1em auto 1em auto;"> |
{|style="width: 62%; height: 200px;" border="1" | {|style="width: 62%; height: 200px;" border="1" | ||
| − | |||
|[[image:1.gif|600px|frame|1. Load the sample data by selecting "Load Data", then "Choose Directory to Add" and finally going to wherever it is that you downloaded the sample data and selecting the folder WhiteMatterExplorationData]] | |[[image:1.gif|600px|frame|1. Load the sample data by selecting "Load Data", then "Choose Directory to Add" and finally going to wherever it is that you downloaded the sample data and selecting the folder WhiteMatterExplorationData]] | ||
|- style="height: 100px;" | |- style="height: 100px;" | ||
| Line 17: | Line 16: | ||
</div> | </div> | ||
| − | <div style="width: 62%; height: | + | ===Segmentation=== |
| + | |||
| + | <div style="width: 62%; height:525px; overflow:auto; border: 2px solid #088; margin: 1em auto 1em auto;"> | ||
| + | {|style="width: 62%; height: 200px;" border="1" | ||
| + | |[[image:5.gif|600px|frame|1. a) Click on the Modules menu and select the module Editor. b)The ‘SlicerApp-real’ window appears. Select the label map GenericAnatomyColors and click Apply.]] | ||
| + | |- style="height: 100px;" | ||
| + | |[[image:6.gif|600px|frame|2. a) Select the PaintEffect b) Scroll down the Editor module and choose color #293 for the region 1 label]] | ||
| + | |- style="height: 100px;" | ||
| + | |[[image:7.gif|600px|frame|3. a) In a single motion, draw a short line in the cystic part of the tumor b) Select color #294 for the mass label and, again in a single motion, draw a short line in the solid part of the tumor c) Select color #295 for the region 3 and draw a circle around the tumor]] | ||
| + | |- style="height: 100px;" | ||
| + | |[[image:8.gif|600px|frame|4. Select the GrowCutEffect tool and then click Apply]] | ||
| + | |- style="height: 100px;" | ||
| + | |[[image:9.gif|600px|frame|5. Scroll up the Editor menu and select the tab Per-Structure Volumes. Then click Split Merge Volume.]] | ||
| + | |- style="height: 100px;" | ||
| + | |[[image:10.gif|600px|frame|6. a) Select the volume BaselineVolumeregion_3-label so that it is highlighted and that the yellow region is visible in the viewer b) Select the ThresholdEffect tool]] | ||
| + | |- style="height: 100px;" | ||
| + | |[[image:11.gif|600px|frame|7. Scroll down the Editor module and set the lower Threshold Range to 1700 and click Apply.]] | ||
| + | |- style="height: 100px;" | ||
| + | |[[image:12.gif|600px|frame|8. a) Select the SaveIslandEffect in the Editor module b) With the SaveIslandEffect tool equipped, click in the occipital horn of the ventricle.]] | ||
| + | |- style="height: 100px;" | ||
| + | |[[image:13.gif|600px|frame|9. a) Scroll back up and click on Merge and Build to merge the different label maps, and generate the 3D models of the tumor and ventricles using a Marching Cubes algorithm. b) Click on the Layout menu and select Conventional.]] | ||
| + | |- style="height: 100px;" | ||
| + | |[[image:14.gif|600px|frame|10. Slicer displays the 3D surface reconstructions of the ventricles, and solid and cystic parts of the tumor.]] | ||
| + | |- style="height: 100px;" | ||
| + | |[[image:15.gif|600px|frame|11. Position the mouse over the pin icon, and select the eye icon to view the all the slices in the 3D viewer.]] | ||
| + | |- style="height: 100px;" | ||
| + | |} | ||
| + | </div> | ||
| + | |||
| + | |||
| + | ===Tractography exploration of peritumoral white matter fibers=== | ||
| + | |||
| + | <div style="width: 62%; height:525px; overflow:auto; border: 2px solid #088; margin: 1em auto 1em auto;"> | ||
{|style="width: 62%; height: 200px;" border="1" | {|style="width: 62%; height: 200px;" border="1" | ||
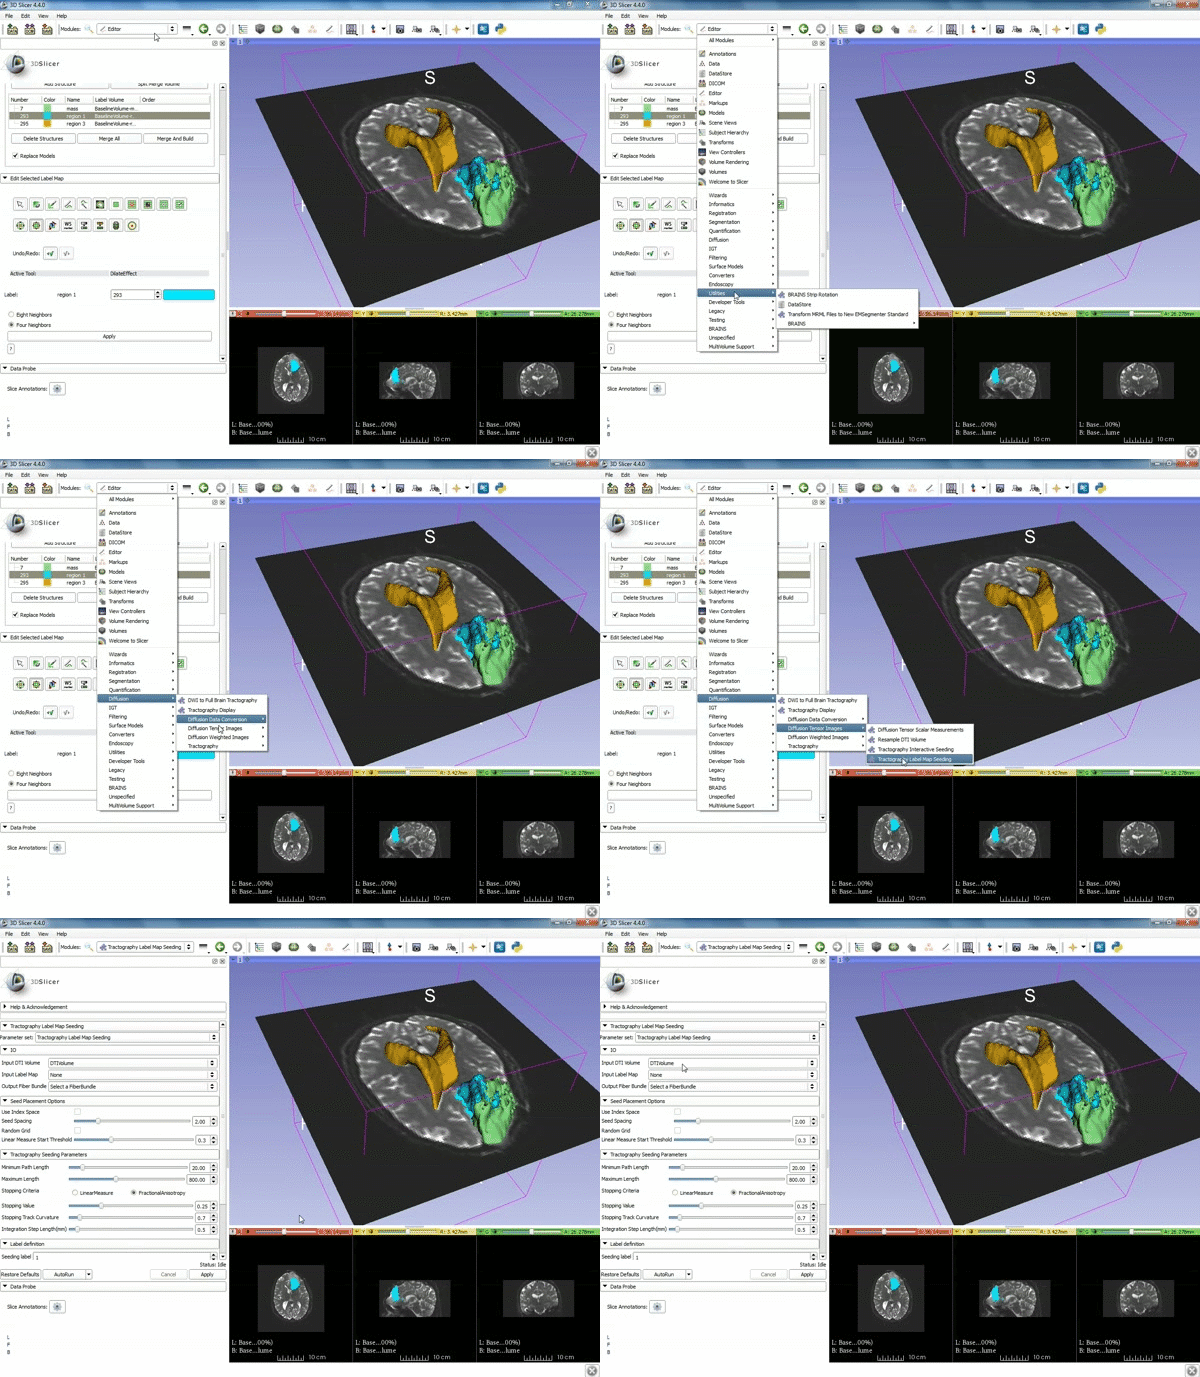
| − | + | |[[image:x.gif|600px|frame|1. a) Make sure the cystic part is selected and visible in the 3 slice views. b) Click on the Dilate Effect tool then click on the cystic part of the tumor on the red slice view.]] | |
| − | |[[image: | ||
|- style="height: 100px;" | |- style="height: 100px;" | ||
| − | |[[image: | + | |[[image:y.gif|600px|frame|2. Click on Apply 3 times to generate the peritumoral volume]] |
|- style="height: 100px;" | |- style="height: 100px;" | ||
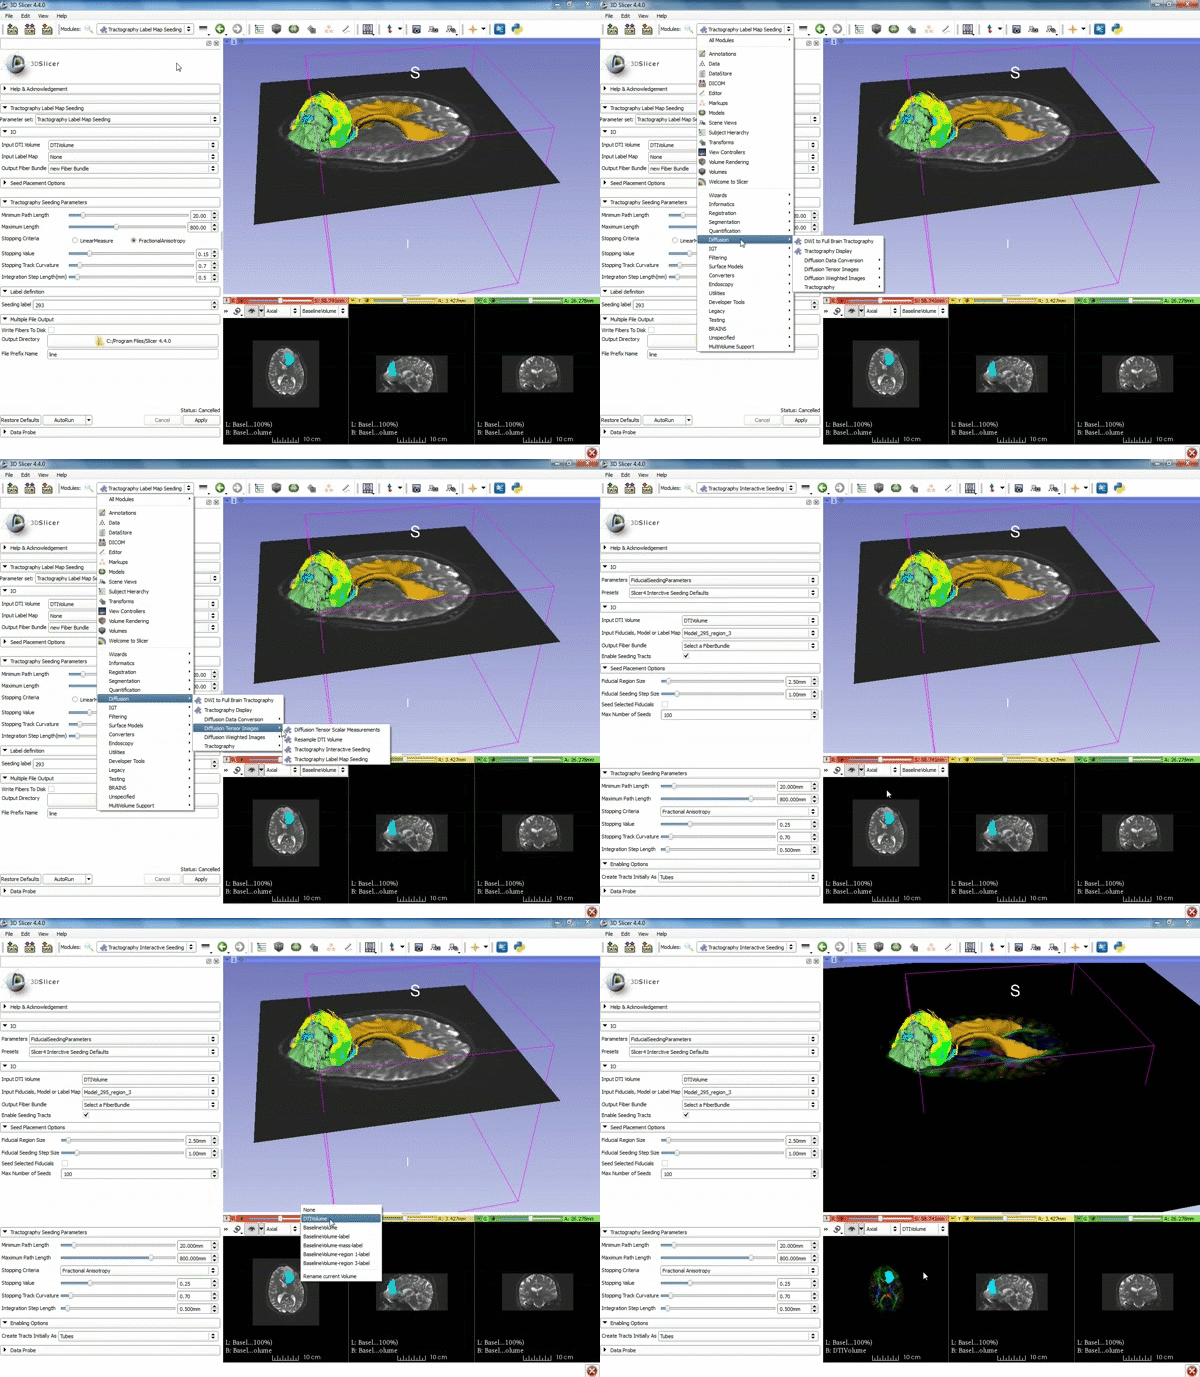
| − | |[[image: | + | |[[image:z.gif|600px|frame|3. Select the module "Tractography Label Map Seeding" by clicking "Editor" at the top, then "Diffusion", then "Diffusion Tensor Imaging".]] |
|- style="height: 100px;" | |- style="height: 100px;" | ||
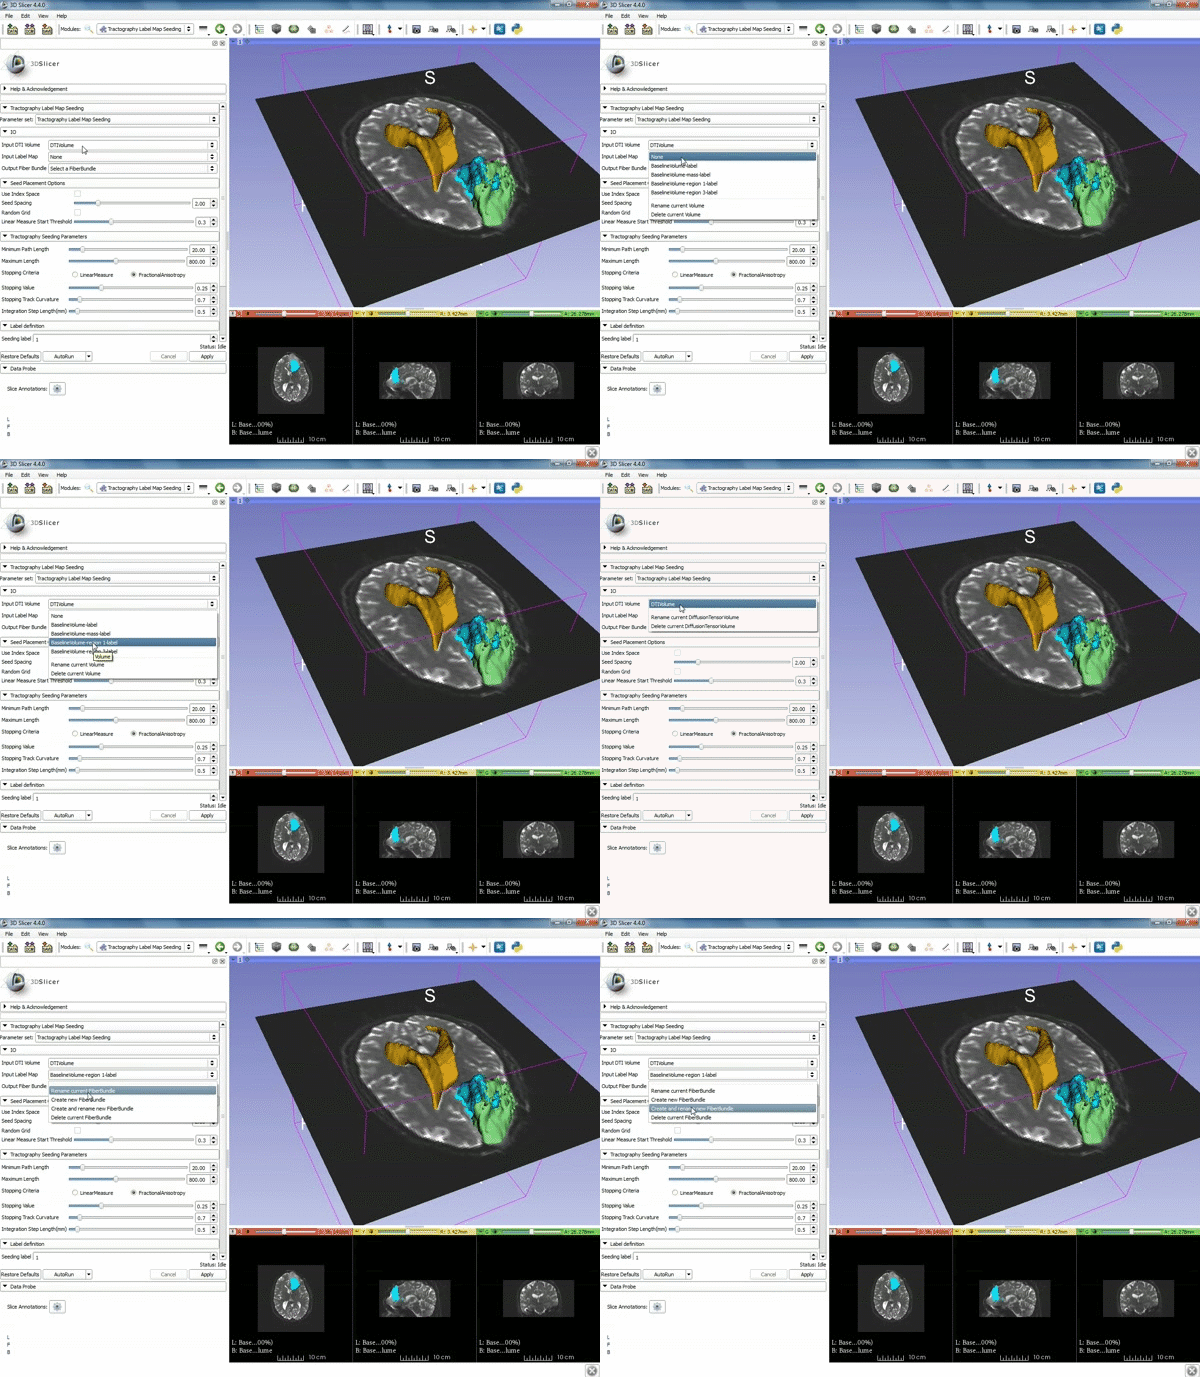
| − | |[[image: | + | |[[image:c.gif|600px|frame|4. Make sure that "DTI Volume" is selected for Input DTI Volume and "BaselineVolumeregion_1-label" is selected for Input Label Map]] |
|- style="height: 100px;" | |- style="height: 100px;" | ||
| − | |[[image: | + | {|style="width: 62%; height: 200px;" border="1" |
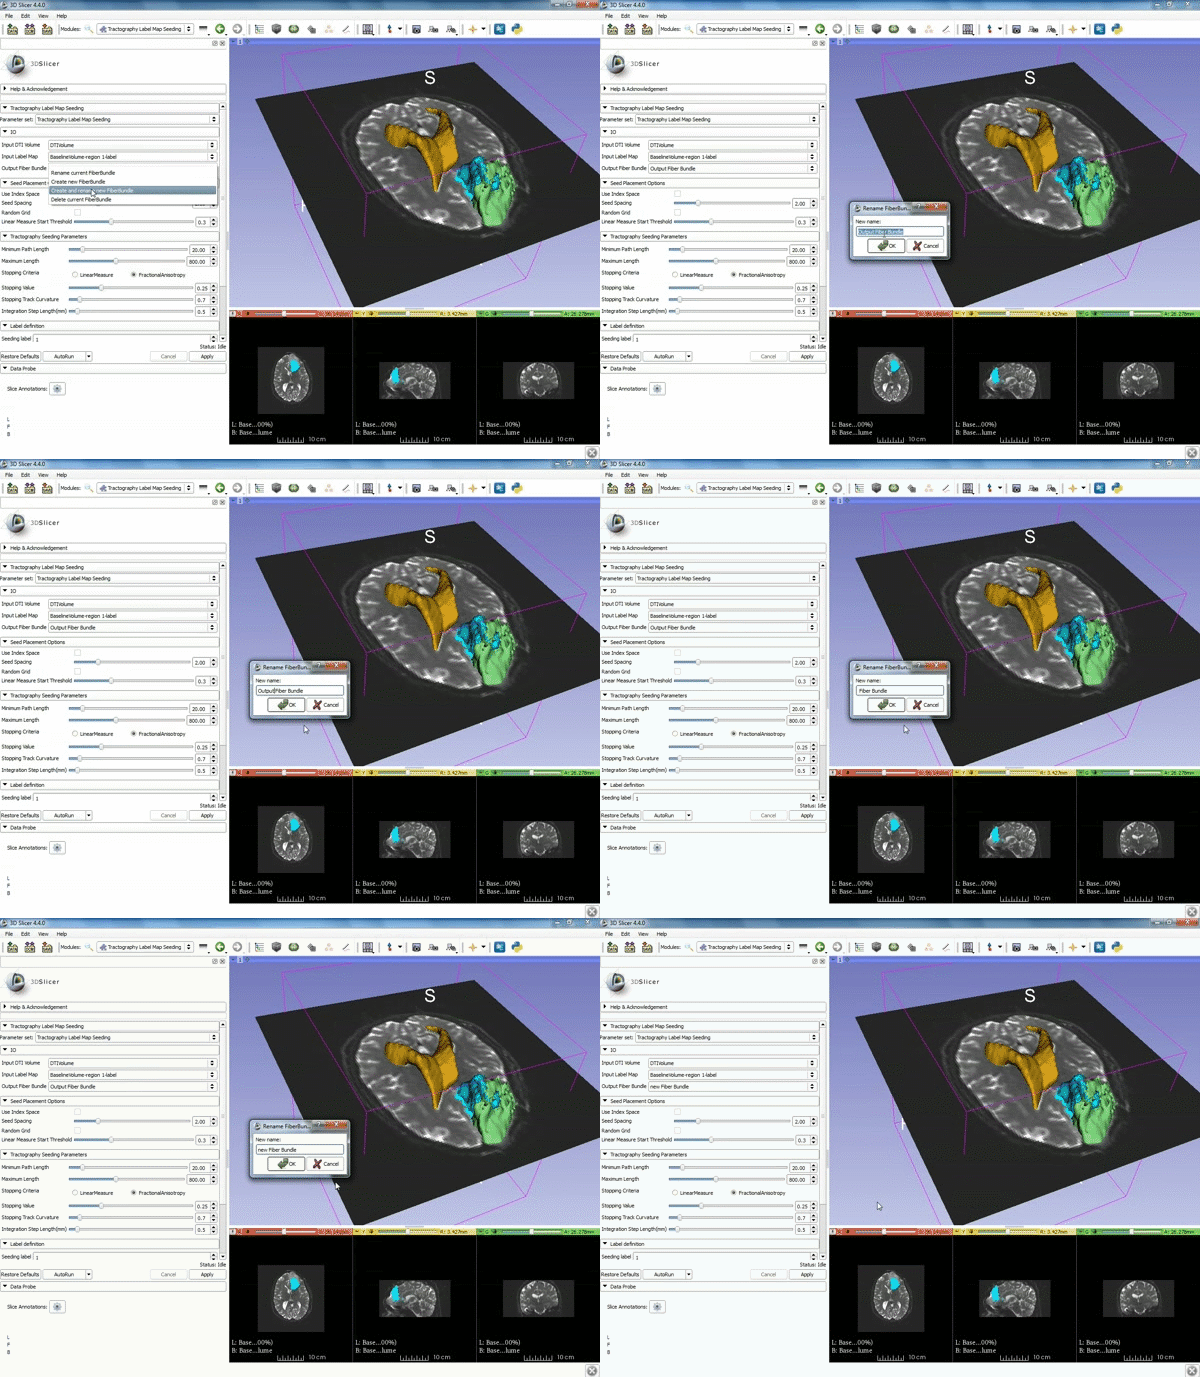
| + | |[[image:a.gif|600px|frame|5. a) For Output Fiber Bundle select "Create and | ||
| + | rename newFiberBundle". b)When the pop-up appears rename the fiber bundle to to "newFiberBundle". ]] | ||
|- style="height: 100px;" | |- style="height: 100px;" | ||
| − | |[[image: | + | |[[image:b.gif|600px|frame|6. a) Under the Seed Placement Options: Check the Use Index Space. b) Under Tractography Seeding parameter set the stopping value to "0.15" and make sure for Stopping Criteria that "Fractional Anisotropy" is selected. ]] |
|- style="height: 100px;" | |- style="height: 100px;" | ||
| − | |[[image: | + | |[[image:d.gif|600px|frame|7. Under Label Definition set the "Seeding Label" to 293, and Click on Apply]] |
|- style="height: 100px;" | |- style="height: 100px;" | ||
| − | |[[image: | + | |} |
| + | </div> | ||
| + | |||
| + | ===Tractography exploration of the ipsilateral and contralateral side === | ||
| + | |||
| + | <div style="width: 62%; height:525px; overflow:auto; border: 2px solid #088; margin: 1em auto 1em auto;"> | ||
| + | {|style="width: 62%; height: 200px;" border="1" | ||
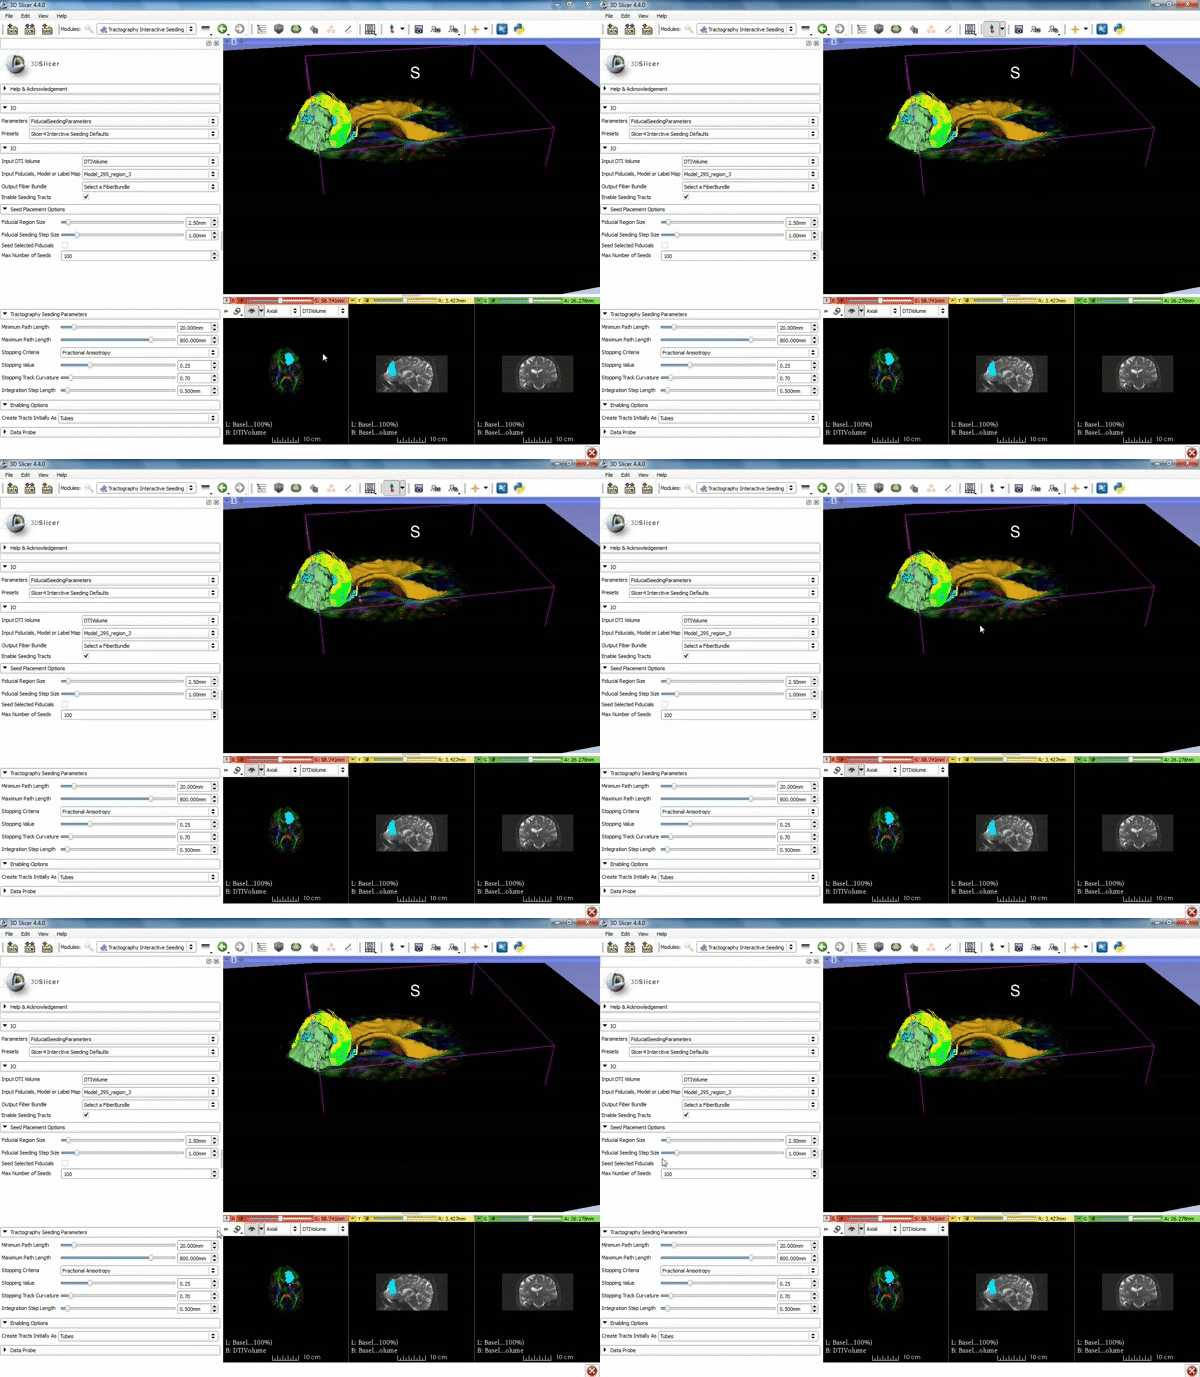
| + | |[[image:l.gif|600px|frame|1. a) Click on the Modules menu and select the module | ||
| + | Tractography Interactive Seeding after selecting "Diffusion" then selecting "Diffusion Tensor Imaging". b) For the Red Slice view position the mouse over the pin icon and change the volume to DTIVolume.]] | ||
|- style="height: 100px;" | |- style="height: 100px;" | ||
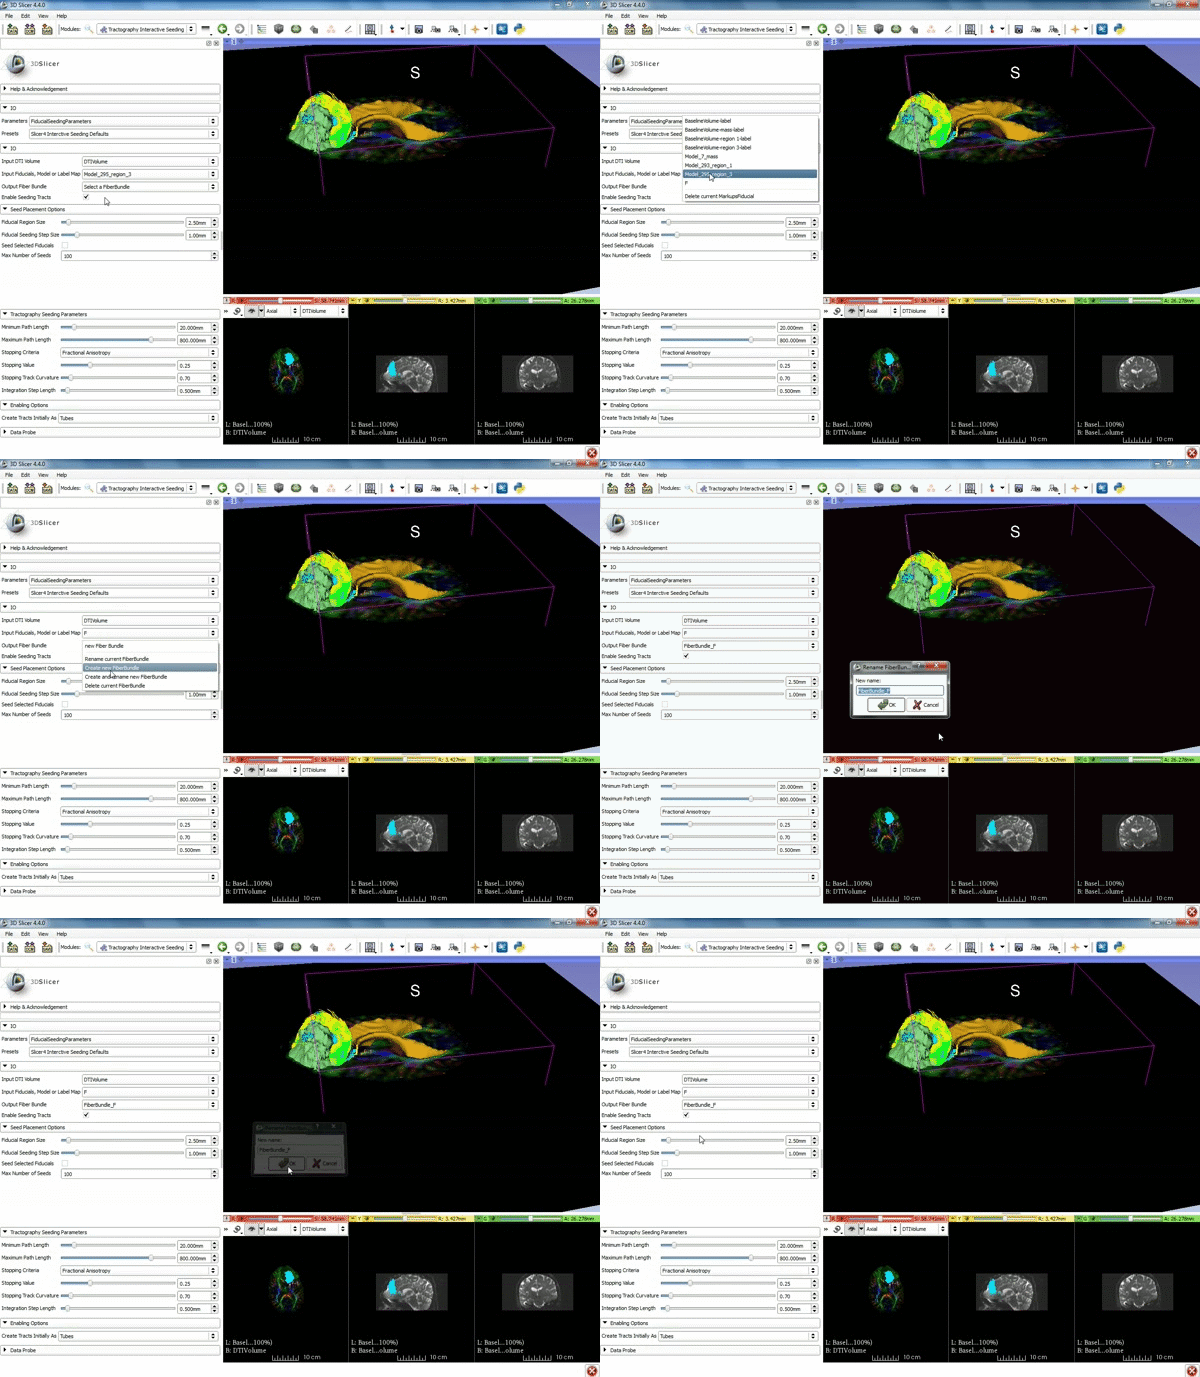
| − | |[[image: | + | |[[image:m.gif|600px|frame|2. Select the Fiducial icon located at the top, and position the F-1 point next to the cystic part of the tumor by clicking near it |
| + | in the 3D viewer.]] | ||
|- style="height: 100px;" | |- style="height: 100px;" | ||
| − | |[[image: | + | |[[image:n.gif|600px|frame|3. Under IO set Input DTI Volume to "DTIVolume", set Fiducial List or Model to "F", set Output Fiber Bundle to "Create new Fiber Bundle", then click ok for the pop-up. ]] |
|- style="height: 100px;" | |- style="height: 100px;" | ||
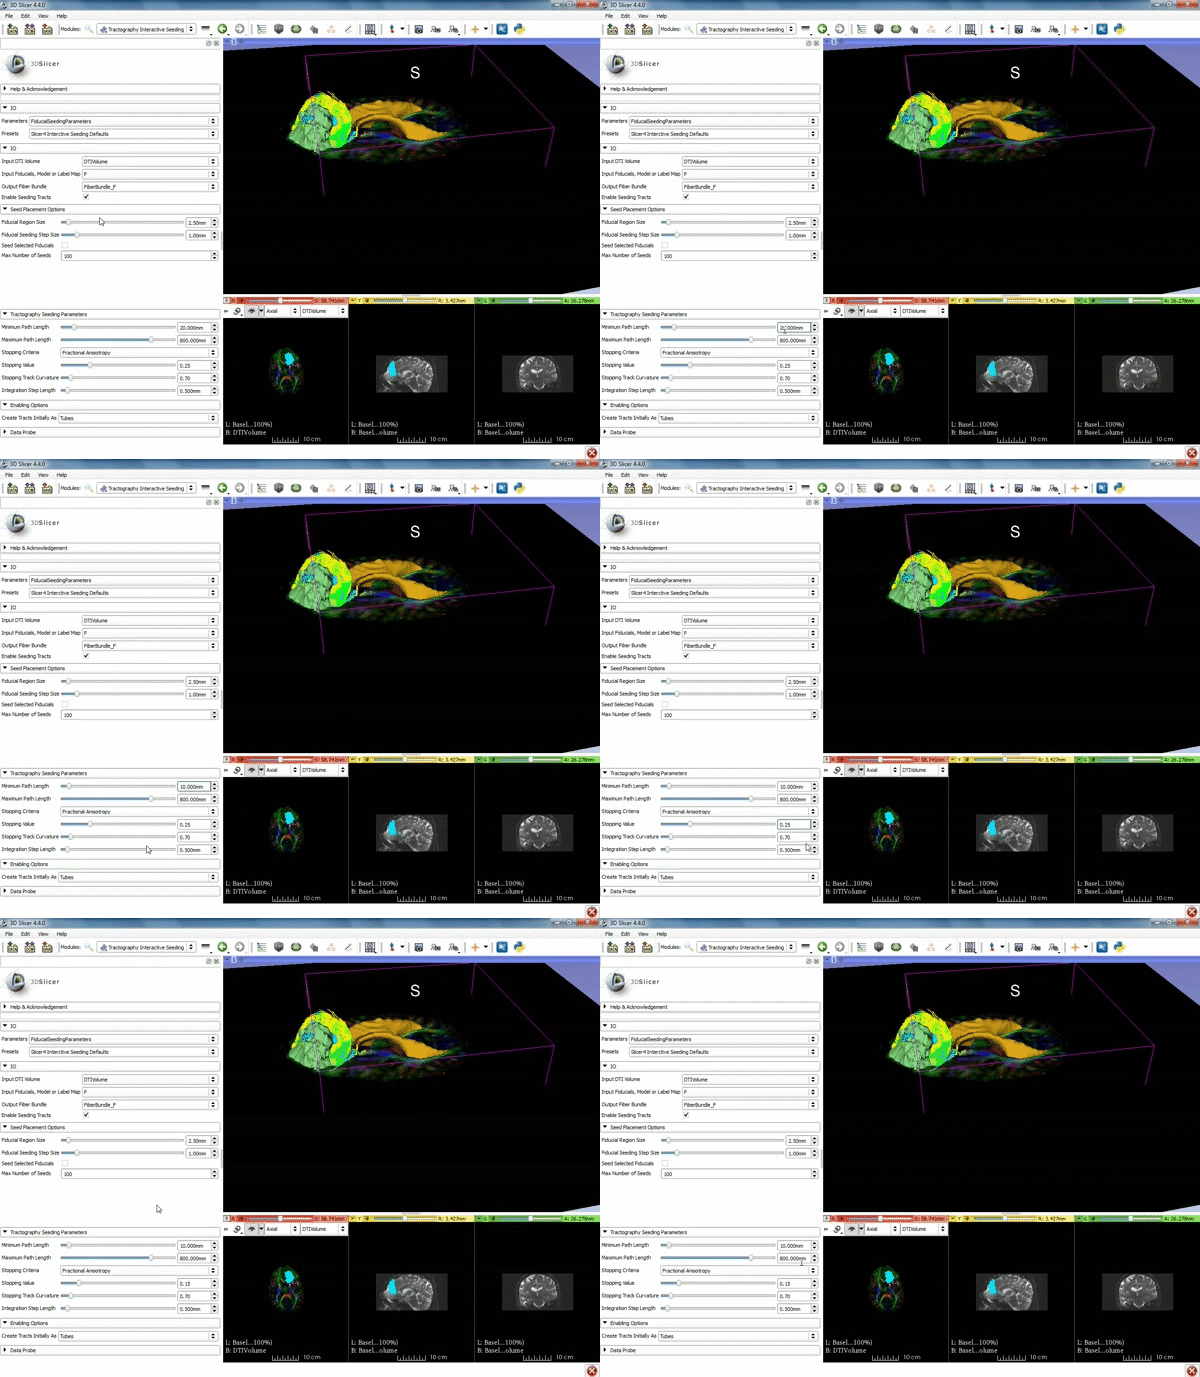
| − | |[[image: | + | |[[image:o.gif|600px|frame|4. Under the "Tractography Seeding Parameters" set the Minimum Path Length to 10.0 mm and the FA Stopping Value at 0.15 ]] |
|- style="height: 100px;" | |- style="height: 100px;" | ||
|} | |} | ||
</div> | </div> | ||
Latest revision as of 20:24, 9 July 2015
Home < Documentation < 4.4 < gif tutorial|
Contents
Loading DTI and Baseline Data
Segmentation
