Difference between revisions of "Documentation/Nightly/Modules/HeterogeneityCAD"
From Slicer Wiki
| Line 119: | Line 119: | ||
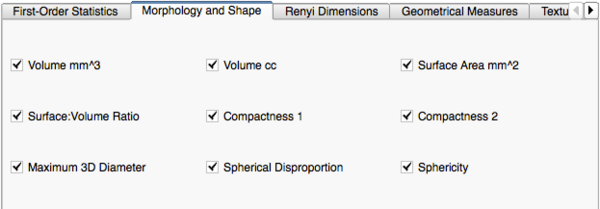
|[[Image:ShapeMorphologyMetrics.png|thumb|600px|Shape and Morphology Metrics]] | |[[Image:ShapeMorphologyMetrics.png|thumb|600px|Shape and Morphology Metrics]] | ||
|} | |} | ||
| + | |||
| + | {| | ||
| + | | | ||
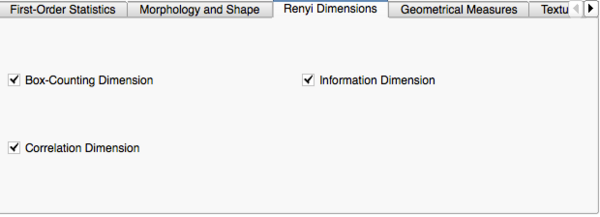
*'''Renyi Dimensions''' | *'''Renyi Dimensions''' | ||
**'''Box-Counting Dimension: '''Part of the family of Renyi Dimensions, where q=0 for Renyi Entropy calculations. This represents the fractal dimension or the slope of the curve on a plot of log(N) vs. log(1/s) where 'N' is the number of boxes occupied by the image ROI at each scale, 's', of an overlaid grid. | **'''Box-Counting Dimension: '''Part of the family of Renyi Dimensions, where q=0 for Renyi Entropy calculations. This represents the fractal dimension or the slope of the curve on a plot of log(N) vs. log(1/s) where 'N' is the number of boxes occupied by the image ROI at each scale, 's', of an overlaid grid. | ||
**'''Information Dimension: '''Part of the family of Renyi Dimensions, where q=1 for Renyi Entropy calculations. | **'''Information Dimension: '''Part of the family of Renyi Dimensions, where q=1 for Renyi Entropy calculations. | ||
**'''Correlation Dimension: '''Part of the family of Renyi Dimensions, where q=2 for Renyi Entropy calculations. | **'''Correlation Dimension: '''Part of the family of Renyi Dimensions, where q=2 for Renyi Entropy calculations. | ||
| − | + | |[[Image:RenyeMetrics.png|thumb|600px|Renye Dimensions]] | |
| + | |} | ||
| + | |||
*'''Geometrical Measures''' | *'''Geometrical Measures''' | ||
**'''Extruded Surface Area: '''The surface area of the binary object when the image ROI is "extruded" into 4D, where the parameter or intensity value defines the shape of the Fourth dimension. | **'''Extruded Surface Area: '''The surface area of the binary object when the image ROI is "extruded" into 4D, where the parameter or intensity value defines the shape of the Fourth dimension. | ||
Revision as of 21:39, 23 July 2014
Home < Documentation < Nightly < Modules < HeterogeneityCAD
|
For the latest Slicer documentation, visit the read-the-docs. |
Introduction and Acknowledgements
|
Extension: OpenCAD | |||||||
This project is supported by P41 RR019703/RR/NCRR NIH HHS/United States, P01 CA067165/CA/NCI NIH HHS/United States and P41 EB015898/EB/NIBIB NIH HHS/United States |
Module Description
The HeterogeneityCAD module is an image feature extraction toolbox primarily to quantify the heterogeneity of tumor images and their label maps.
|
Tutorials
Data sets
Quick Instructions for Use
- Add an image or parameter map (.nrrd file) to the Nodes List
- Select a corresponding segmentation label map to use as ROI
- Click "Apply HeterogeneityCAD"
Image Features and Metrics
|
|
|
- Geometrical Measures
- Extruded Surface Area: The surface area of the binary object when the image ROI is "extruded" into 4D, where the parameter or intensity value defines the shape of the Fourth dimension.
- Extruded Volume: The volume of the binary object when the image ROI is 'extruded' into 4D, where the parameter or intensity value defines the shape of the Fourth dimension
- Extruded Surface:Volume Ratio: The ratio of the surface area to the volume of the binary object when the image ROI is 'extruded' into 4D, where the parameter or intensity value defines the shape of the Fourth dimension.
- Extruded Box-Dimension:
- Texture: Gray-Level Co-occurrence Matrix (GLCM)
- Autocorrelation: A measure of the magnitude of the fineness and coarseness of texture.
\sum_{i=1}^{Ng}\sum_{j=1}^{Ng}{ij\mathbf{P}\(i j)}
- Cluster Prominence: A measure of the skewness and asymmetry of the GLCM. A higher values implies more asymmetry about the mean value while a lower value indicates a peak around the mean value and less variation about the mean.
- Cluster Shade: A measure of the skewness and uniformity of the GLCM. A higher cluster shade implies greater asymmetry.
- Cluster Tendency: Indicates the number of potential clusters present in the image.
- Contrast: A measure of the local intensity variation, favoring P(i,j) values away from the diagonal (i != j), with a larger value correlating with larger image variation.
- Correlation: A value between 0 (uncorrelated) and 1 (perfectly correlated) showing the linear dependency of gray level values in the GLCM. For a symmetrical GLCM, ux = uy (means of px and py) and sigx = sigy (standard deviations of px and py).
- Difference Entropy:
- Dissimilarity:
- Energy (GLCM): Also known as the Angular Second Moment and is a measure of the homogeneity of an image. A homogeneous image will contain less discrete gray levels, producing a GLCM with fewer but relatively greater values of P(i,j), and a greater sum of the squares.
- Entropy(GLCM): Indicates the uncertainty of the GLCM. It measures the average amount of information required to encode the image values.
- Homogeneity 1: A measure of local homogeneity that increases with less contrast in the window.
- Homogeneity 2: A measure of local homogeneity.
- Informational Measure of Correlation 1 (IMC1):
- Informational Measure of Correlation 2 (IMC2):
- Inverse Difference Moment Normalized (IDMN): A measure of the local homogeneity of an image. IDMN weights are the inverse of the Contrast weights (decreasing exponentially from the diagonal i=j in the GLCM). Unlike Homogeneity 2, IDMN normalizes the square of the difference between values by dividing over the square of the total number of discrete values.
- Inverse Difference Normalized (IDN): Another measure of the local homogeneity of an image. Unlike Homogeneity 1, IDN normalizes the difference between the values by dividing over the total number of discrete values.
- Inverse Variance:
- Maximum Probability:
- Sum Average:
- Sum Entropy:
- Sum Variance: Weights elements that differ from the average value of the GLCM.
- Variance (GLCM): The dispersion of the parameter values around the mean of the combinations of reference and neighborhood pixels, with values farther from the mean weighted higher. A high variance indicates greater distances of values from the mean.
- Texture: Gray-Level Run Length Matrix (GLRL)
- Short Run Emphasis (SRE): A measure of the distribution of short run lengths, with a greater value indicative of shorter run lengths and more fine textural textures.
- Long Run Emphasis (LRE): A measure of the distribution of long run lengths, with a greater value indicative of longer run lengths and more coarse structural textures.
- Gray Level Non-Uniformity (GLN): Measures the similarity of gray-level intensity values in the image, where a lower GLN value correlates with a greater similarity in intensity values.
- Run Length Non-Uniformity (RLN): Measures the similarity of run lengths throughout the image, with a lower value indicating more homogeneity among run lengths in the image.
- Run Percentage (RP): Measures the homogeneity and distribution of runs of an image for a certain direction
- Low Gray Level Run Emphasis (LGLRE): Measures the distribution of low gray-level values, with a higher value indicating a greater concentration of low gray-level values in the image.
- High Gray Level Run Emphasis (HGLRE): Measures the distribution of the higher gray-level values, with a higher value indicating a greater concentration of high gray-level values in the image.
- Short Run Low Gray Level Emphasis (SRLGLE): Measures the joint distribution of shorter run lengths with lower gray-level values.
- Short Run High Gray Level Emphasis (SRHGLE): Measures the joint distribution of shorter run lengths with higher gray-level values.
- Long Run Low Gray Level Emphasis (LRLGLE): Measures the joint distribution of long run lengths with lower gray-level values.
- Long Run High Gray Level Emphasis (LRHGLE)Measures the joint distribution of long run lengths with higher gray-level values.
Similar Modules
N/A
References
N/A
Information for Developers
Source code: https://github.com/vnarayan13/Slicer-OpenCAD
